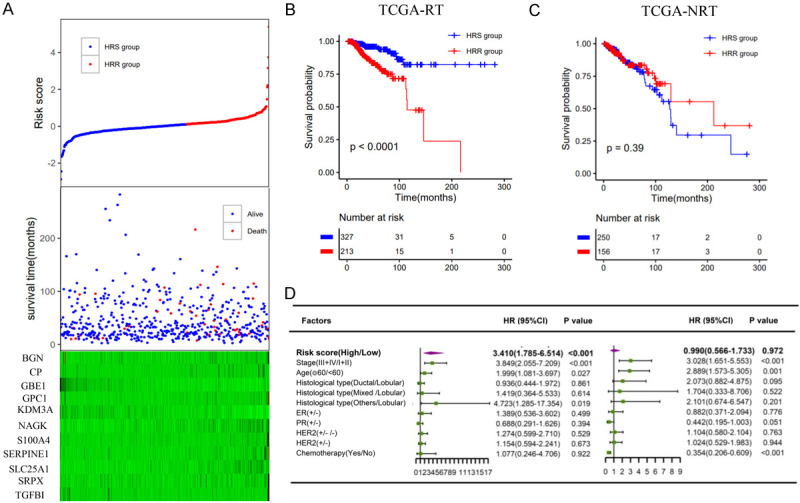
Figure 4.

Construction of the hypoxia radiosensitivity signature in the TCGA dataset. A. The risk score and the survival time of radiotherapy patients; B, C. Kaplan-Meier survival curves of the HRS group and HRR group in radiotherapy patients and nonradiotherapy patients, respectively; D. Multivariate analysis containing risk core and clinical factors in radiotherapy patients and nonradiotherapy patients, respectively.
