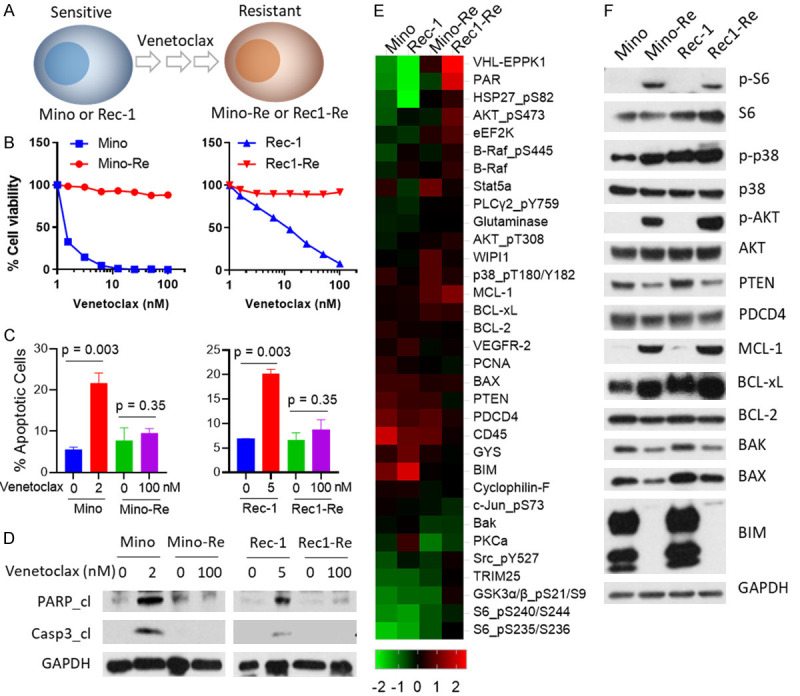
Figure 1.

Establishment of venetoclax-resistant cell lines and differential gene expression associated with acquired venetoclax resistance. (A) Two sensitive MCL cell lines (Mino and Rec-1) were exposed to increasing doses of venetoclax stepwise up to 1000 nM. (B) 8-dose cell viability was performed in both parental and resistant cell lines for 72 h. Each treatment for the cell viability assay was set up in triplicate. (C) Mino cells were treated with 2 nM venetoclax, Rec-1 cells were treated with 5 nM venetoclax, the corresponding resistant cells were treated with 100 nM venetoclax for 24 h, and apoptosis was measured by annexin-V/PI assay. Annexin-V+PI- subpopulation and annexin-V+PI+ subpopulations were summed up as total apoptosis. Each treatment for the cell apoptosis assay was set up in triplicate. (D) Cells with the same treatments as described in (C) were collected for western blot. Total PARP, cleaved PARP, total caspase-3, and cleaved caspase-3 were detected in these cell lines. GAPDH was used as internal loading control. Each experiment in (B-D) was repeated three times. (E) Heatmaps of dysregulated proteins. 5×10⁶ cells of each cell line (Mino, Mino-Re, Rec-1 and Rec1-Re) were collected and subjected to RPPA analysis. 425 proteins in total were detected, and proteins with at least two-fold change were selected for generating the heatmap. High-expressing proteins are shown in red, and low-expressing proteins are shown in green. Each sample for RPPA analysis was set up in triplicate. (F) Western blotting was used to confirm dysregulated protein expression comparing parental and resistant cell lines.
