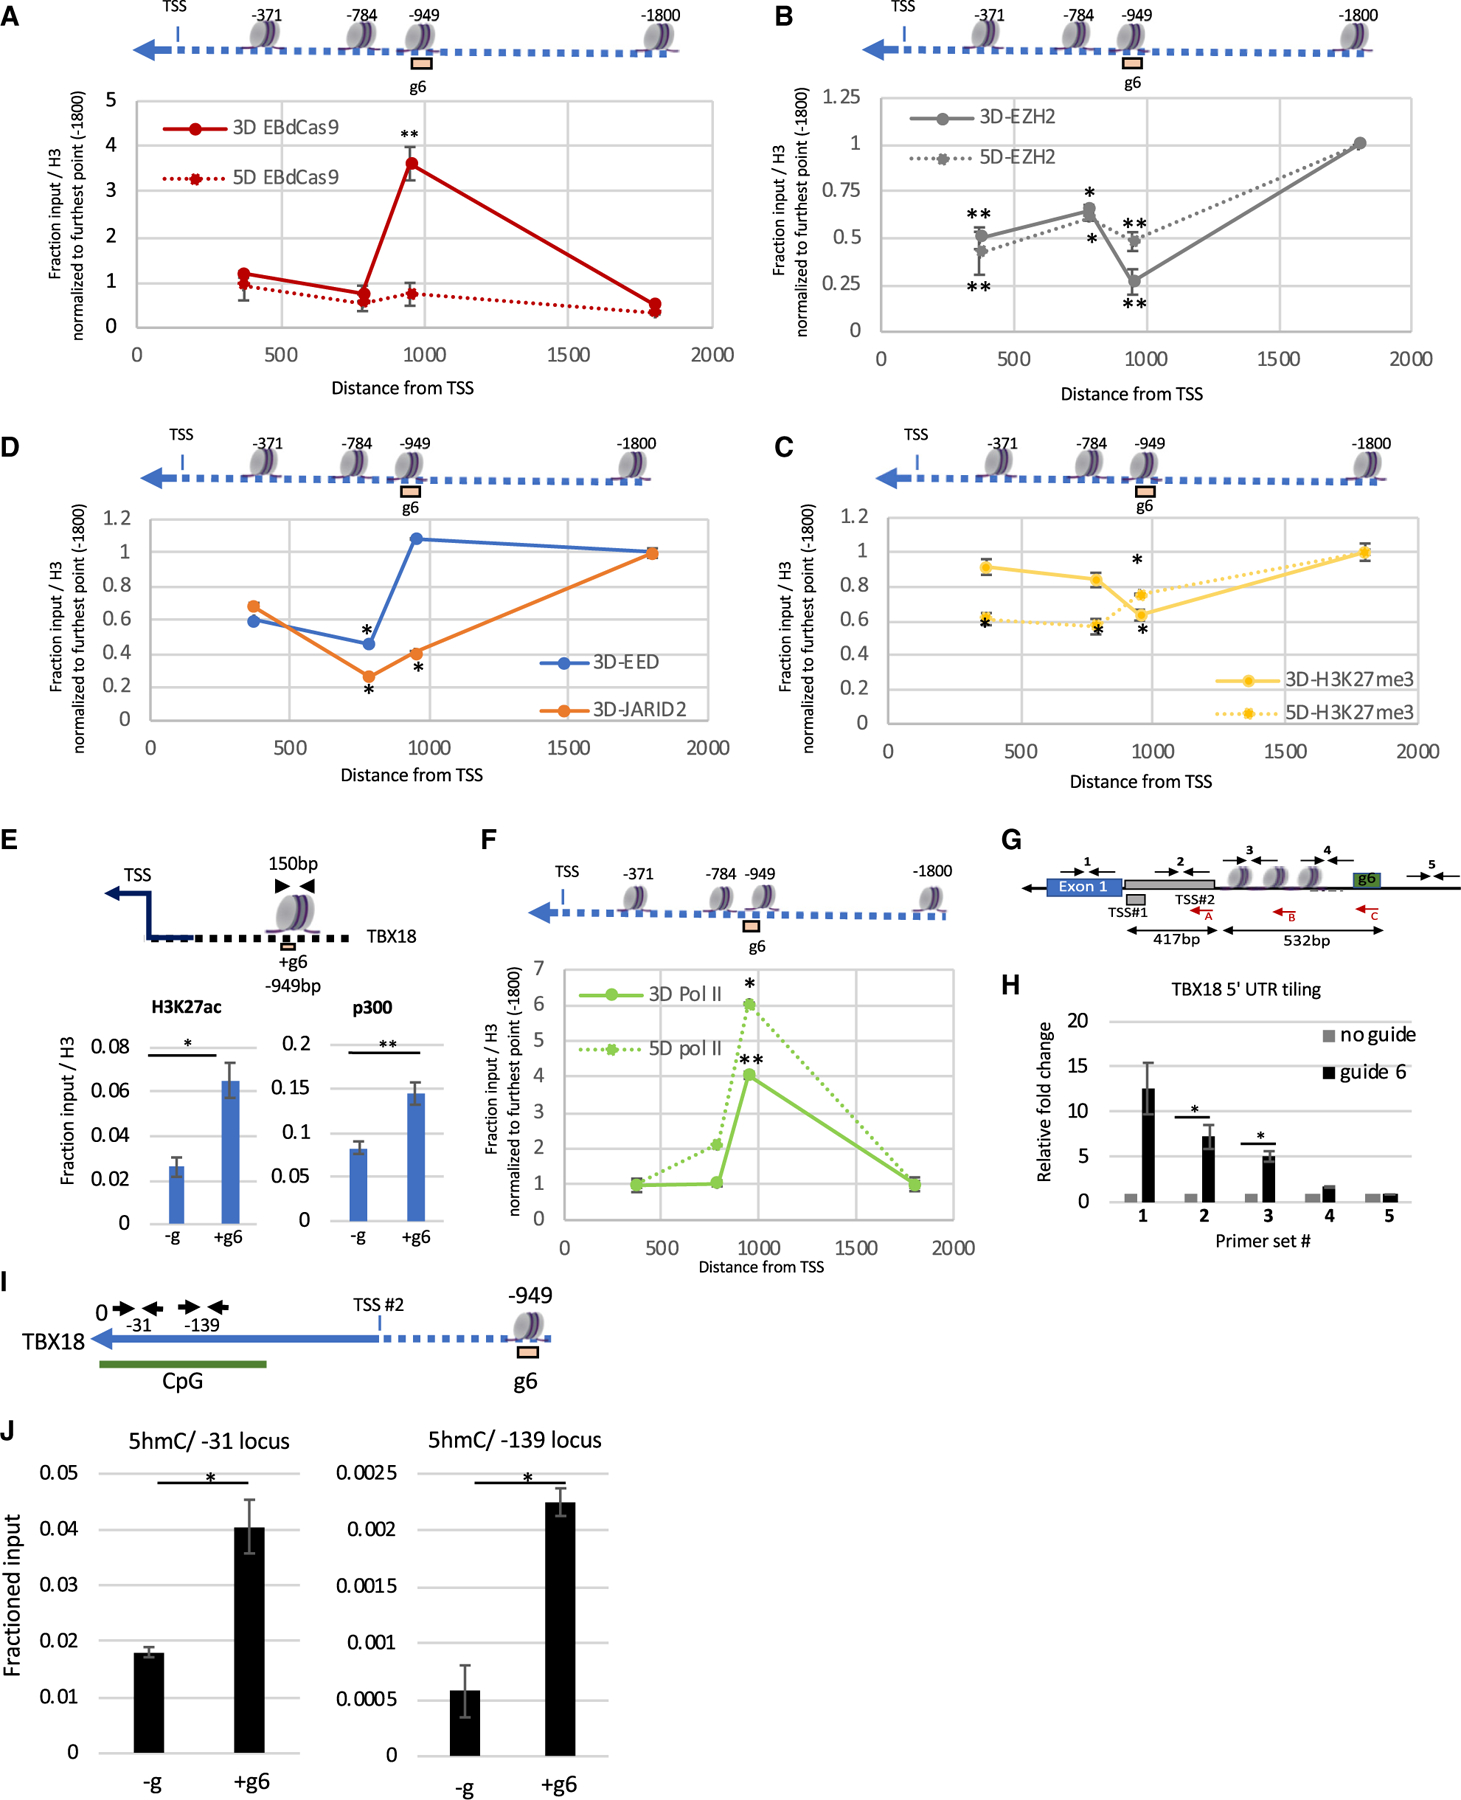
Figure 3. EBdCas9 causes epigenomic spreading and recruits activation marks.

(A–D) Tiling of EBdCas9/+g6 ChIP (A) Cas9, (B) EZH2, (C)H3K27me3, (D) EED, and JARID 2 on TBX18 genomic loci (bp) relative to the TSS (listed above nucleosome) using qPCR; solid red lines are day 3 and dashed red lines are day 5. Each point is the relative fold change TBX18 g6RNA (+g6) versus no guide (–g), normalized to the respective fraction of input/H3 and compared with the relative fold change using −1,800 bp primer set as control (n = 3, SEM; *p < 0.05, **p < 0.01, ***p < 0.001, two-tailed t test).
(E) ChIP-qPCR of 3-days-induced EBdCas9 and TBX18 g6 RNA (+g6) transfected or not (–g) using H3K27ac and p300 and normalized as a fraction of input/H3. Genomic region analyzed by qPCR is the TBX18 g6 locus and is denoted above (n = 3, SEM; *p < 0.05, **p < 0.01, ***p < 0.001, two-tailed t test).
(F) Tiling of EBdCas9/+g6 ChIP (RNA Pol II CTD) on TBX18 genomic loci (bp) relative to the TSS (listed above nucleosome) using qPCR exactly as in (A); solid green lines are day 3 and dashed green lines are day 5 (as described in A–D). Analyzed exactly as in (A).
(G) Illustration of TBX18 TSS peak position relative to the g6 region in bp.
(A–C) Red arrows denote the reversed primer used for cDNA reverse transcription. Internal black arrows with Arabic numbers denote the PCR amplicon generated following cDNA production: (C) corresponds to primer set #4; (B) corresponds to #3; and (A) corresponds to primer sets #2, #1, and #5.
(H) RNA expression of TBX18 5′UTR region using qRT-PCR (reverse primer in red) after 3 days of transfection with TBX18 g6 RNA (g6) or no transfection (no guide). Regions amplified correspond to #1–#5 and are indicated with black arrows. Normalized to β-actin, and the relative fold change is compared with no guide (n = 3, SEM; *p < 0.05, **p < 0.01, ***p < 0.001, two-tailed t test).
(I) Illustration of TBX18 CpG locus using UCSC Genome Browser (GRCh36/hg36) Assembly. ‘‘0’’ denotes first Met relative to the g6 region in bp. Small black arrows annotate the loci for qPCR amplification in (J).
(J) MedIP-qPCR of induced (+Dox) EBdCas9 after 3 days of transfection with TBX18 g6 RNA (+g6) or no transfection (–g) using 5 hydroxymethylcytosine (5hmC) Abs. Normalized to fractioned input (n = 2, SEM; *p < 0.05, **p < 0.01, ***p < 0.001, two-tailed t test).
