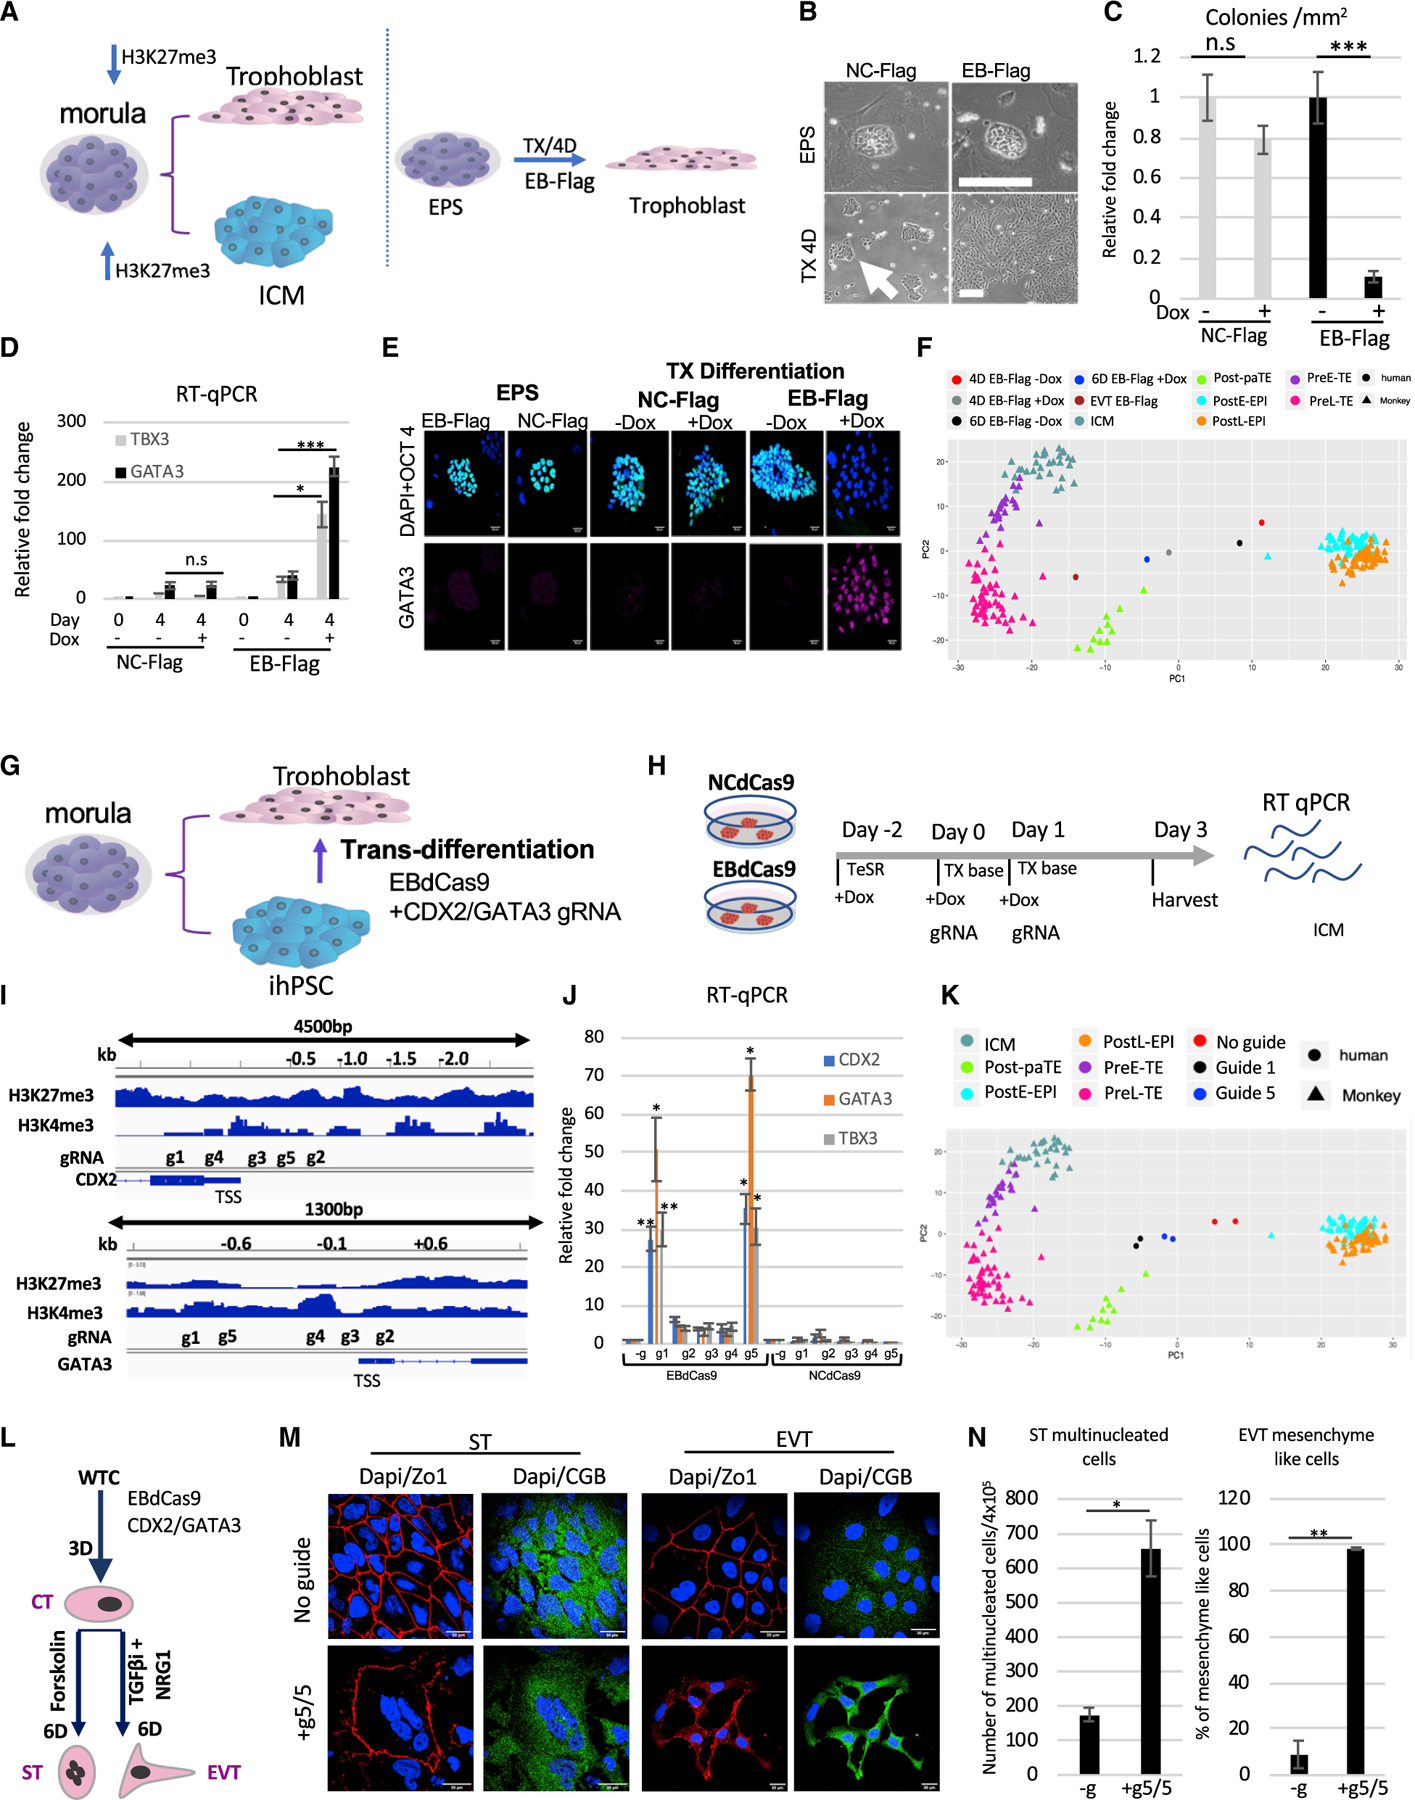
Figure 6. Trophoblast trans-differentiation using EBdCas9.

(A) Morula bifurcation to trophoblast and ICM is H3K27me3 dependent (left panel). EPS differentiation using EB-FLAG and TX media (Kubaczka et al., 2014) (right panel).
(B) WTC EB-FLAG or WTC NC-FLAG as described previously (Moody et al., 2017) were reprogramed to EPS for 2 weeks (3 passages). Bright field of colony morphology of EPS EB-FLAG or NC-FLAG induced with Dox on MEFs for 4 days or plated on matrigel in TX media (TGF-b1, FGF4, and heparin) for 4 days.
(C) Colony morphology count following 4 days in TX media EB-FLAG compared with NC-FLAG (n = 3, SEM; *p < 0.05, **p < 0.01, ***p < 0.001, two-tailed t test).
(D) qRT-PCR of EB-FLAG and NC-FLAG either in EPS stage or 4 days in trophoblast differentiation (TX media) with (+) or without (–) Dox. Normalized to b-actin and relative to EPS EB-FLAG stage (n = 3, SEM; *p < 0.05, **p < 0.01, ***p < 0.001, two-tailed t test).
(E) Immunofluorescence of EPS EB-FLAG or EPS NC-FLAG on MEF/LCDM media or differentiation using matrigel/TX media with (+) or without Dox (–). DAPI, blue; WGA, red; OCT4, green; GATA3, far red. Scale bar, 50 µm.
(F) PCA of EPS samples compared to monkey single-cell RNA-seq (Nakamura et al., 2017). EB-FLAG EPS cells were differentiating in TX media with or without Dox for 4 days or 6 days or passaged 3 times as extravillous cytotrophoblasts (EVTs). Cell types in the monkey single-cell data include the following: Post-paTE, post-implantation parietal trophectoderm; PreL-TE, pre-implantation late TE; PreE-TE, pre-implantation early TE; ICM, inner cell mass; Pre-EPI, pre-implantation epiblast; PostE-EPI, post-implantation early epiblast; PostL-EPI, post-implantation late epiblast.
(G) Model of WTC EBdCas9 trans-differentiation to trophoblasts using CDX2 and GATA3 gRNA cocktail.
(H) Timeline of EBdCas9 or NCdCas9 induction and gRNA transfection.
(I) Tiling of CDX2 and GATA3 promoter and gene body gRNA.
(J) qRT-PCR analysis of CDX2 and GATA3 of co-transfected gRNAs in the presence of EBdCas9 or NCdCas9 induction (+Dox). g1–g5 correspond to g1/g1, g2/g2, g3/g3, g4/g4, and g5/g5 CDX2/GATA3 co-transfection. Normalized to β-actin and compared with no guide (–g) (n = 3, SEM; *p < 0.05, **p < 0.01, ***p < 0.001, two-tailed t test)
(K) PCA of day 3 WTC EBdCas9 co-transfected with g5/g5 CDX2/GATA3 and g1/g1 CDX2/GATA3 or not transfected (–g) bulk RNA-seq compared with monkey single-cell RNA-seq (Nakamura et al., 2017). Cell types are exactly as in (F).
(L) Timeline of EVT and syncytio trophoblast (ST) differentiation after EBdCas9:CDX2/GATA3 g5,g5 transfection (cytotrophoblast [CT]-like stage) and the factors used.
(M) Immunofluorescence of EBdCas9 3 days post-CDX2/GATA3 g5,g5 RNA transfection compared with no guide and further 6-day differentiation to either EVT using differentiation factors (see STAR Methods). DAPI, blue; ZO-1, red; chorionic gonadotropin beta (CGB), green. Scale bar, 30 mm.
(N) Quantification of ST-(multinucleation) and EVT-(mesenchyme-like morphology) positive cell count. Area of total count is 18 mm2 (n = 2, SEM; *p < 0.05, **p < 0.01, ***p < 0.001, two-tailed t test).
