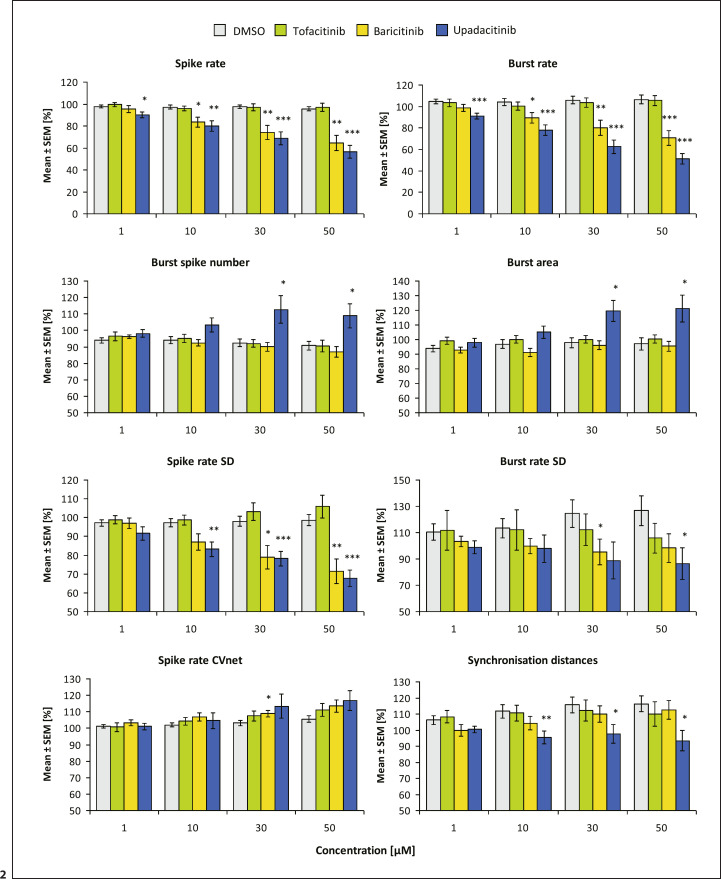
Fig. 2.
Concentration-responses of DMSO (0.002–0.1%), tofacitinib, baricitinib, and upadacitinib (1–50 μM) on frontal cortex networks. Values are mean ± SEM with statistical significance (*/**/** for p ≤ 0.05/0.01/0.001). Values of rows 2–4 are scaled to a minimum of 50%. DMSO, dimethyl sulfoxide; SEM, standard error of mean.

