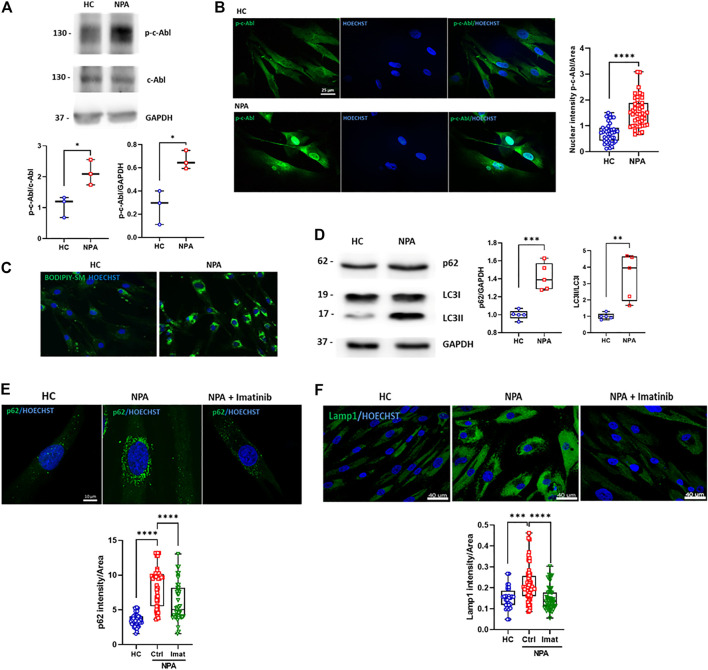
FIGURE 1.
c-Abl activation regulates autophagy and lysosomal alterations in NPA fibroblasts. (A) Human fibroblasts homogenates from NPA patient and healthy control (HC) subjects (50 μg protein/lane) were used to measure p-c-Abl levels. The graph shows quantifications of p-c-Abl levels normalized by GAPDH and c-Abl expression. The data shown are from three independent experiments. Student’s t-test: *p < 0.05. (B) HC and NPA fibroblasts were fixed and immunostained using an anti-p-c-Abl Tyr412 antibody (green) and Hoechst staining for nucleus (blue). For each condition, n = 15 cells were measured by experiment; three independent experiments were performed. Student’s t-test: ****p < 0.0001. (C) HC and NPA fibroblasts were incubated with BODIPY-SM to confirm sphingomyelin accumulation. The images were taken with a × 40 objective lens. (D) Homogenates from fibroblasts from NPA patient and healthy control (HC) subject (50 μg protein/lane) were used to measure p62 and LC3II levels. The graph shows quantifications of protein levels normalized by GAPDH and LC3I expression, respectively. The image is representative of five independent experiments. Student’s t-test: **p < 0.01; ***p < 0.001; (E) HC and NPA fibroblasts were treated with imatinib (10 μM) for 24 h, fixed, and immunostained using an anti-p62 antibody (green) and (F) anti-Lamp1 (green). Hoechst staining for the nucleus (blue). For each condition, n = 10–18 cells were measured by experiment; three independent experiments were performed. ANOVA, Tukey post-hoc: ***p < 0.001; ****p < 0.0001. In the box-and-whisker plots, the center line denotes the median value, edges are upper and lower quartiles and whiskers show minimum and maximum values.

