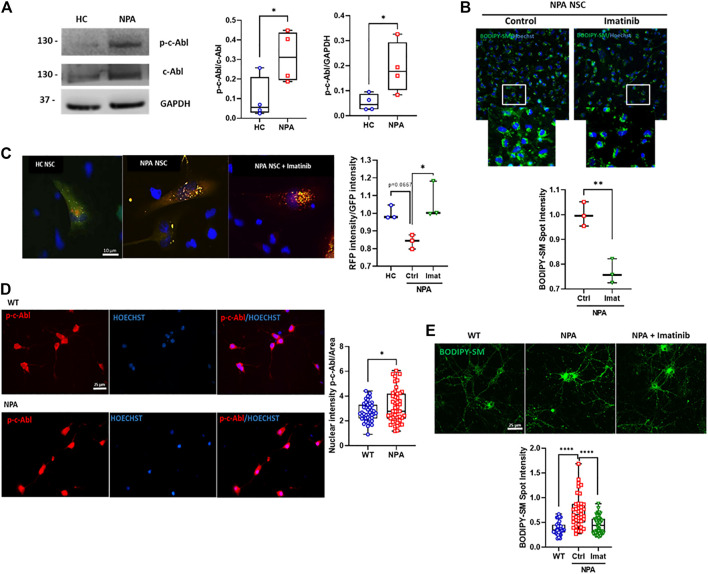
FIGURE 2.
c-Abl inhibition improves autophagy flux and decreases sphingomyelin accumulation in NPA neuronal models. (A) p-c-Abl levels were measured in Neural Stem Cells (NSCs) extracts by Western blot. Images representative from four independent experiments are shown. Student’s t-test: *p < 0.05. (B) BODIPY-SM staining indicates sphingomyelin accumulation. Fluorescent microscopic images of NPA NSCs treated imatinib 0.001 µM by 24 h. For each condition, n = 150 cells were measured by experiment; three independent experiments were performed. Student’s t-test: **p < 0.01. (C) NPA NSCs expressing mRFP-GFP-LC3 were treated with imatinib 0.001 µM by 24 h or vehicle. Graph shows the rate between RFP intensity and GFP intensity corresponding to autolysosomes. For each condition, n = 50 cells were measured by experiment; three different experiments were performed. Student’s t-test: *p < 0.05. (D) Primary neurons were 7 days in vitro, fixed, and immunostained using anti-p-c-Abl Tyr412 antibody (red) and Hoechst staining for nucleus (blue). For each condition, n = 10–20 neurons were measured by experiment; three independent experiments were performed. Student’s t-test: *p < 0.05. (E) Primary hippocampal neurons were treated with imatinib 5 µM by 24 h. Sphingomyelin accumulation was analyzed by BODIPY-SM. For each condition, n = 10–20 neurons were measured by experiment; three independent experiments were performed. ANOVA, Tukey post-hoc: ****p < 0.0001. In the box-and-whisker plots, the center line denotes the median value, edges are upper and lower quartiles and whiskers show minimum and maximum values.

