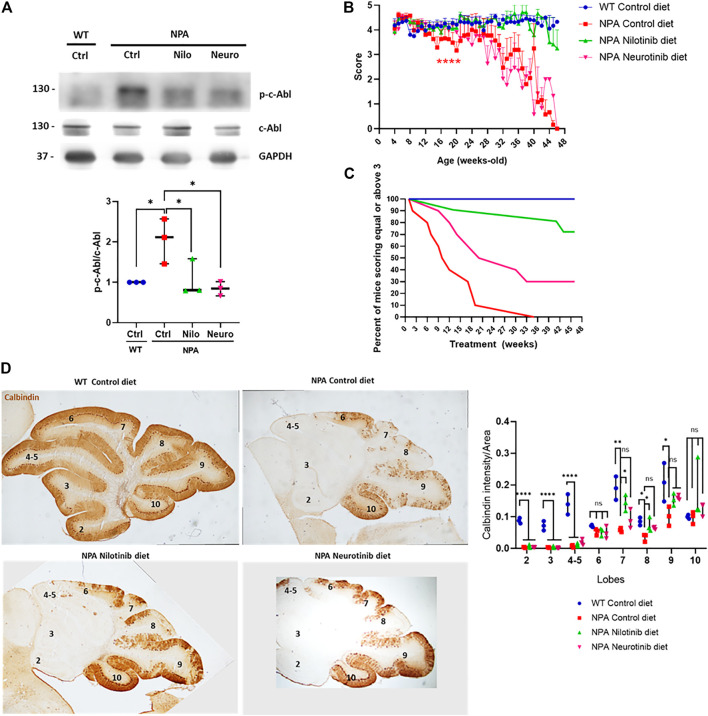
FIGURE 4.
Chronic c-Abl inhibition treatment delays locomotor impairment in NPA mice. WT and NPA mice received nilotinib (200 ppm; 30 mg/kg) and neurotinib (67 ppm; 10 mg/kg) supplemented diets or control diet starting at p21 until 11 months of age. (A) p-c-Abl protein levels were evaluated in cerebellum homogenates from WT and NPA mice of 5 months of age by Western blot. The number of animals was three by condition. ANOVA, Tukey post-hoc:*p < 0.05. (B) Motor coordination was assessed weekly by the Hanging test. Data are shown as mean ± SEM. ANOVA, Tukey post-hoc: ****p < 0.0001; NPA control is statistically different from WT control and nilotinib NPA. (C) Deterioration curve of mice was performed using percent of mice with a score equal to or above 3. For (B,C), the following number of animals was used: WT control (Ctrl) = 10; NPA control (Ctrl) = 10; NPA nilotinib (Nilo) = 11; NPA neurotinib (Neuro) = 10. (D) Purkinje neuron marker Calbindin was analyzed by immunohistochemistry. Calbindin intensity was quantified. A representative image by condition is shown (n = 3 mice/group). Images were taken with × 2 objective. ANOVA, Tukey post-hoc: *p < 0.05; **p < 0.01; ***p < 0.001; ****p < 0.0001. In the box-and-whisker plots, the center line denotes the median value, edges are upper and lower quartiles, whiskers show minimum and maximum values and points are the number of animals used.

