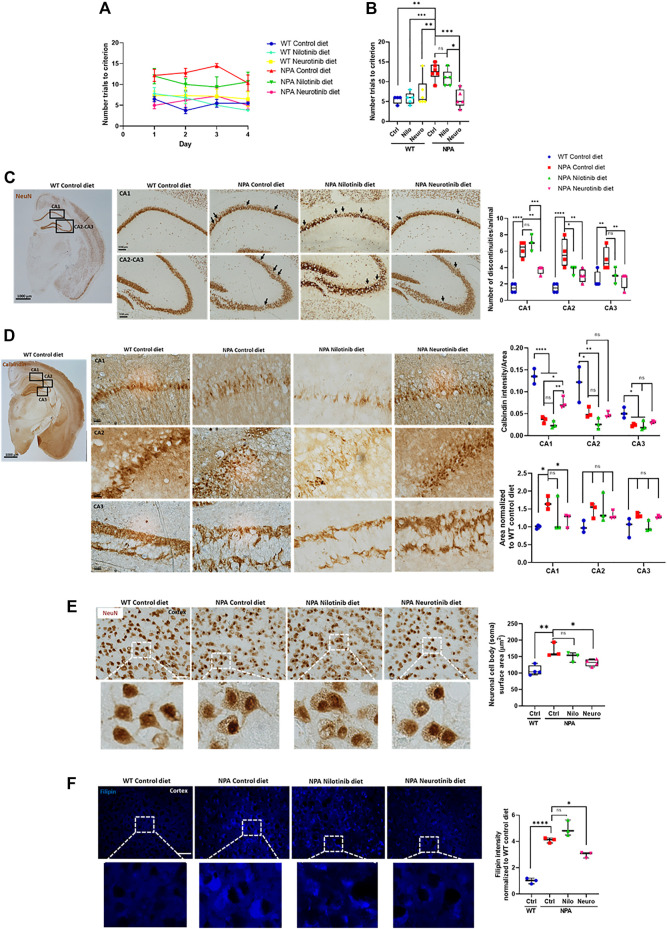
FIGURE 5.
Chronic c-Abl inhibition treatment improves cognitive decline and decreases brain neuronal disorganization in NPA mice. WT and NPA mice received nilotinib (200 ppm) and neurotinib (67 ppm) supplemented diets or control diet starting at p21 until 7 months of age. (A) Memory flexibility test was used to evaluate cognitive functions. Graphs show the number of trials every day during the test (A) and the average among 4 days of test (B). The number of animals was: WT control (Ctrl) diet = 4; WT nilotinib (Nilo) diet = 5; WT neurotinib (Neuro) diet = 6; NPA control diet = 6; NPA nilotinib (Nilo) diet = 5; NPA neurotinib (Neuro) diet = 5. ANOVA, Tukey post-hoc: *p < 0.05; **p < 0.01; ***p < 0.001 (C) Coronal sections of WT and NPA brain were stained with anti-NeuN antibody and 3,39-diaminobenzidine as chromogen. The rectangles in the first photo indicate where the magnification shown in the following photos comes from. Arrows point to actual discontinuities. Graph bars indicating discontinuity differences between WT and NPA mice with treatment in hippocampal subfields CA1, CA2, and CA3. Data are shown as the number of discontinuities/animal. The following number of animals was used: WT control = 4; NPA control = 4; NPA nilotinib = 3; NPA neurotinib = 4. ANOVA, Tukey post-hoc: *p < 0.05; **p < 0.01; ***p < 0.001; ****p < 0.0001. (D) Coronal sections were stained with calbindin which is a member of the large EF-hand family of calcium-binding proteins. These staining methods evidenced well-defined layers in the cortex and hippocampus structure. Neuronal disorganization with a decreased number of neurons is evident. The rectangles in the first photo indicate where the magnification shown in the following photos comes from. Image representative is shown. The following number of animals was used: WT control = 3; NPA control = 3; NPA nilotinib = 3; NPA neurotinib = 3. ANOVA, Tukey post-hoc: *p < 0.05; **p < 0.01; ****p < 0.0001. (E) Cortex neurons of the brains from WT and NPA mice were stained with NeuN antibody and 3,39-diaminobenzidine as chromogen. The area of the neuronal body was measured. 50 cells were measured by each mouse. The following number of animals was used: WT control (Ctrl) = 4; NPA control (Ctrl) = 3; NPA nilotinib = 3; NPA neurotinib = 4. ANOVA, Tukey post-hoc: *p < 0.05; **p < 0.01. (F) Slices were stained with Filipin staining to evaluate lipid accumulation. The following number of animals was used: WT control (Ctrl) = 3; NPA control (Ctrl) = 3; NPA nilotinib = 3; NPA neurotinib = 3. Image representative. ANOVA, Tukey post-hoc: *p < 0.05; ****p < 0.0001. Scale bar = 50 μm. In the box-and-whisker plots, the center line denotes the median value, edges are upper and lower quartiles, whiskers show minimum and maximum values and points are individual experiments.

