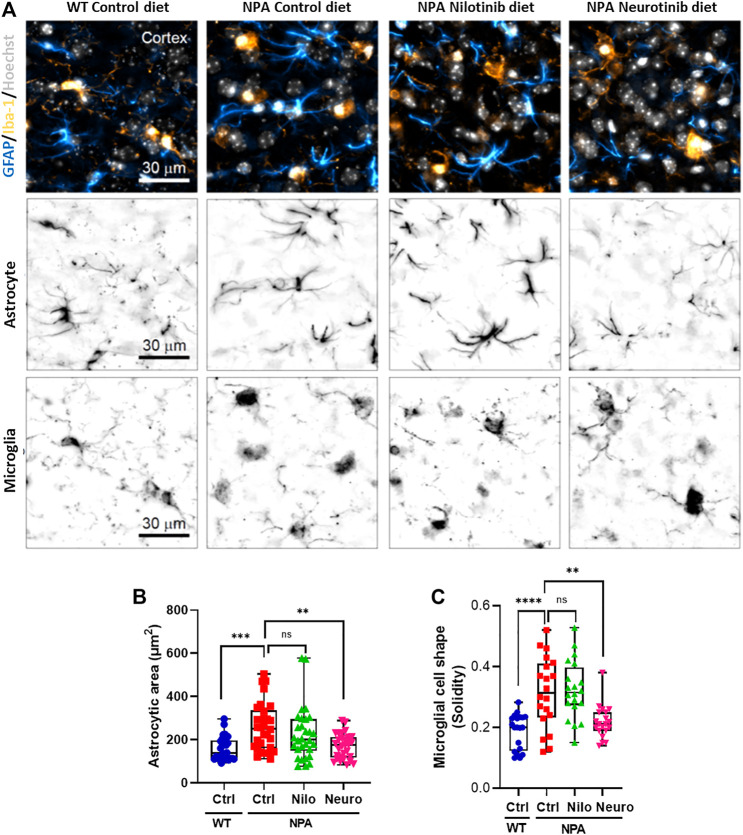
FIGURE 6.
Chronic c-Abl inhibition decreases glial activation in NPA mice. WT and NPA mice received nilotinib (200 ppm; 30 mg/kg) and neurotinib (67 ppm; 10 mg/kg) supplemented diets or control diet starting at p21 until 7 months of age. (A) Markers of astrocyte (GFAP) and microglia (Iba-1) were analyzed by immunofluorescence in slices of brain from WT and NPA mice. Confocal images were obtained of the cortex for each condition. A representative image of the cortex is shown in the first row; astrocytes (cyan hot), microglia (orange hot), and nucleus (grays). Representative images to visualize astrocyte and microglial shape are shown in the second and third row, respectively. (B) Astrocyte area was measured from GFAP positive cells. For each condition, n = 10 cells were measured by animal; three mice/group. ANOVA, Tukey post-hoc: **p < 0.01, ***p < 0.001. (C) Microglia shape was determined from Iba-1 fluorescence. For each condition, n = 5–10 cells were measured by animal; three mice/group. ANOVA, Tukey post-hoc: **p < 0.01, ****p < 0.0001. In the box-and-whisker plots, the center line denotes the median value, edges are upper and lower quartiles and whiskers show minimum and maximum values.

