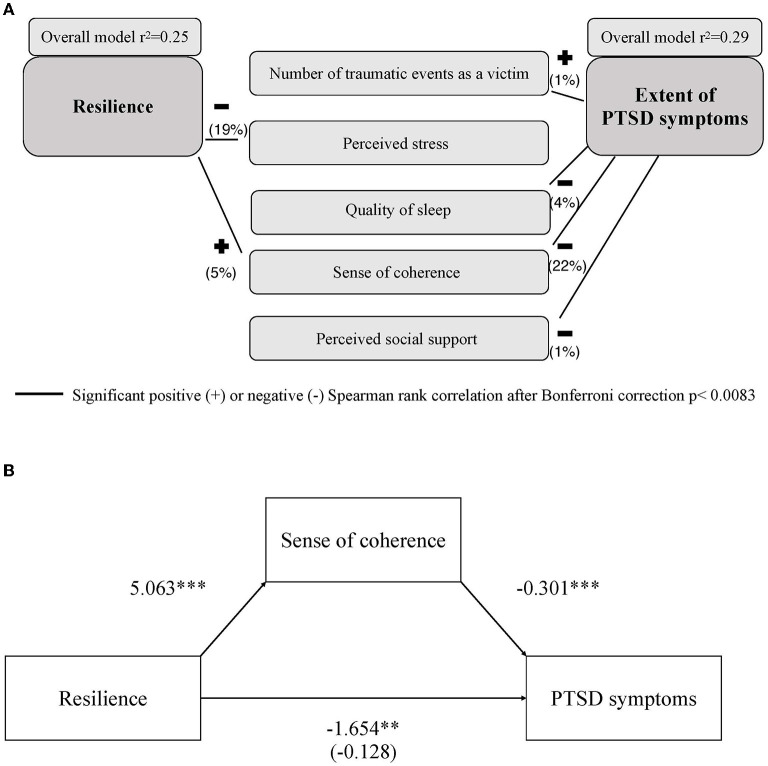
Figure 2.
(A) Depicts the predictive model of resilience (left) and severity of PTSD symptoms (right). Black lines indicate the positive and negative Spearman rank correlations of resilience and severity of PTSD symptoms with the variables included in the respective models. Numbers in brackets indicate the explained variance of the individual predictive factors. (B) Shows the mediation model of sense of coherence (mediator) between resilience (predictor) and severity of PTSD symptoms (dependent variable). **p < 0.01, ***p < 0.001.

