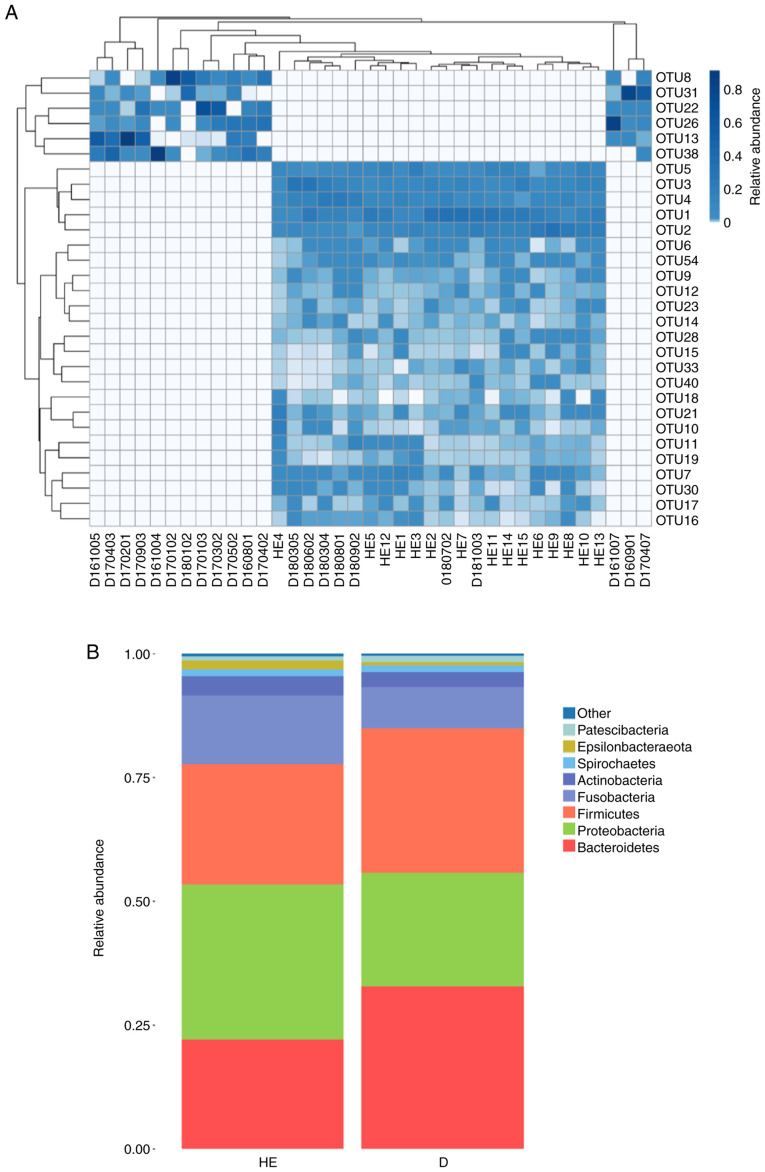
Figure 2.
(A) Heatmap analysis based on OTU abundance. Different colors indicate relative abundance. The relative abundance increases from white to blue. In the heatmap, the x-axis indicates the patient ID number and the y-axis indicates the OTU number. (B) Comparison of the relative abundance at the phyla level between patients with membranous nephropathy and healthy controls. OTU, operational taxonomic unit; HE, healthy control samples; D, membranous nephropathy samples.

