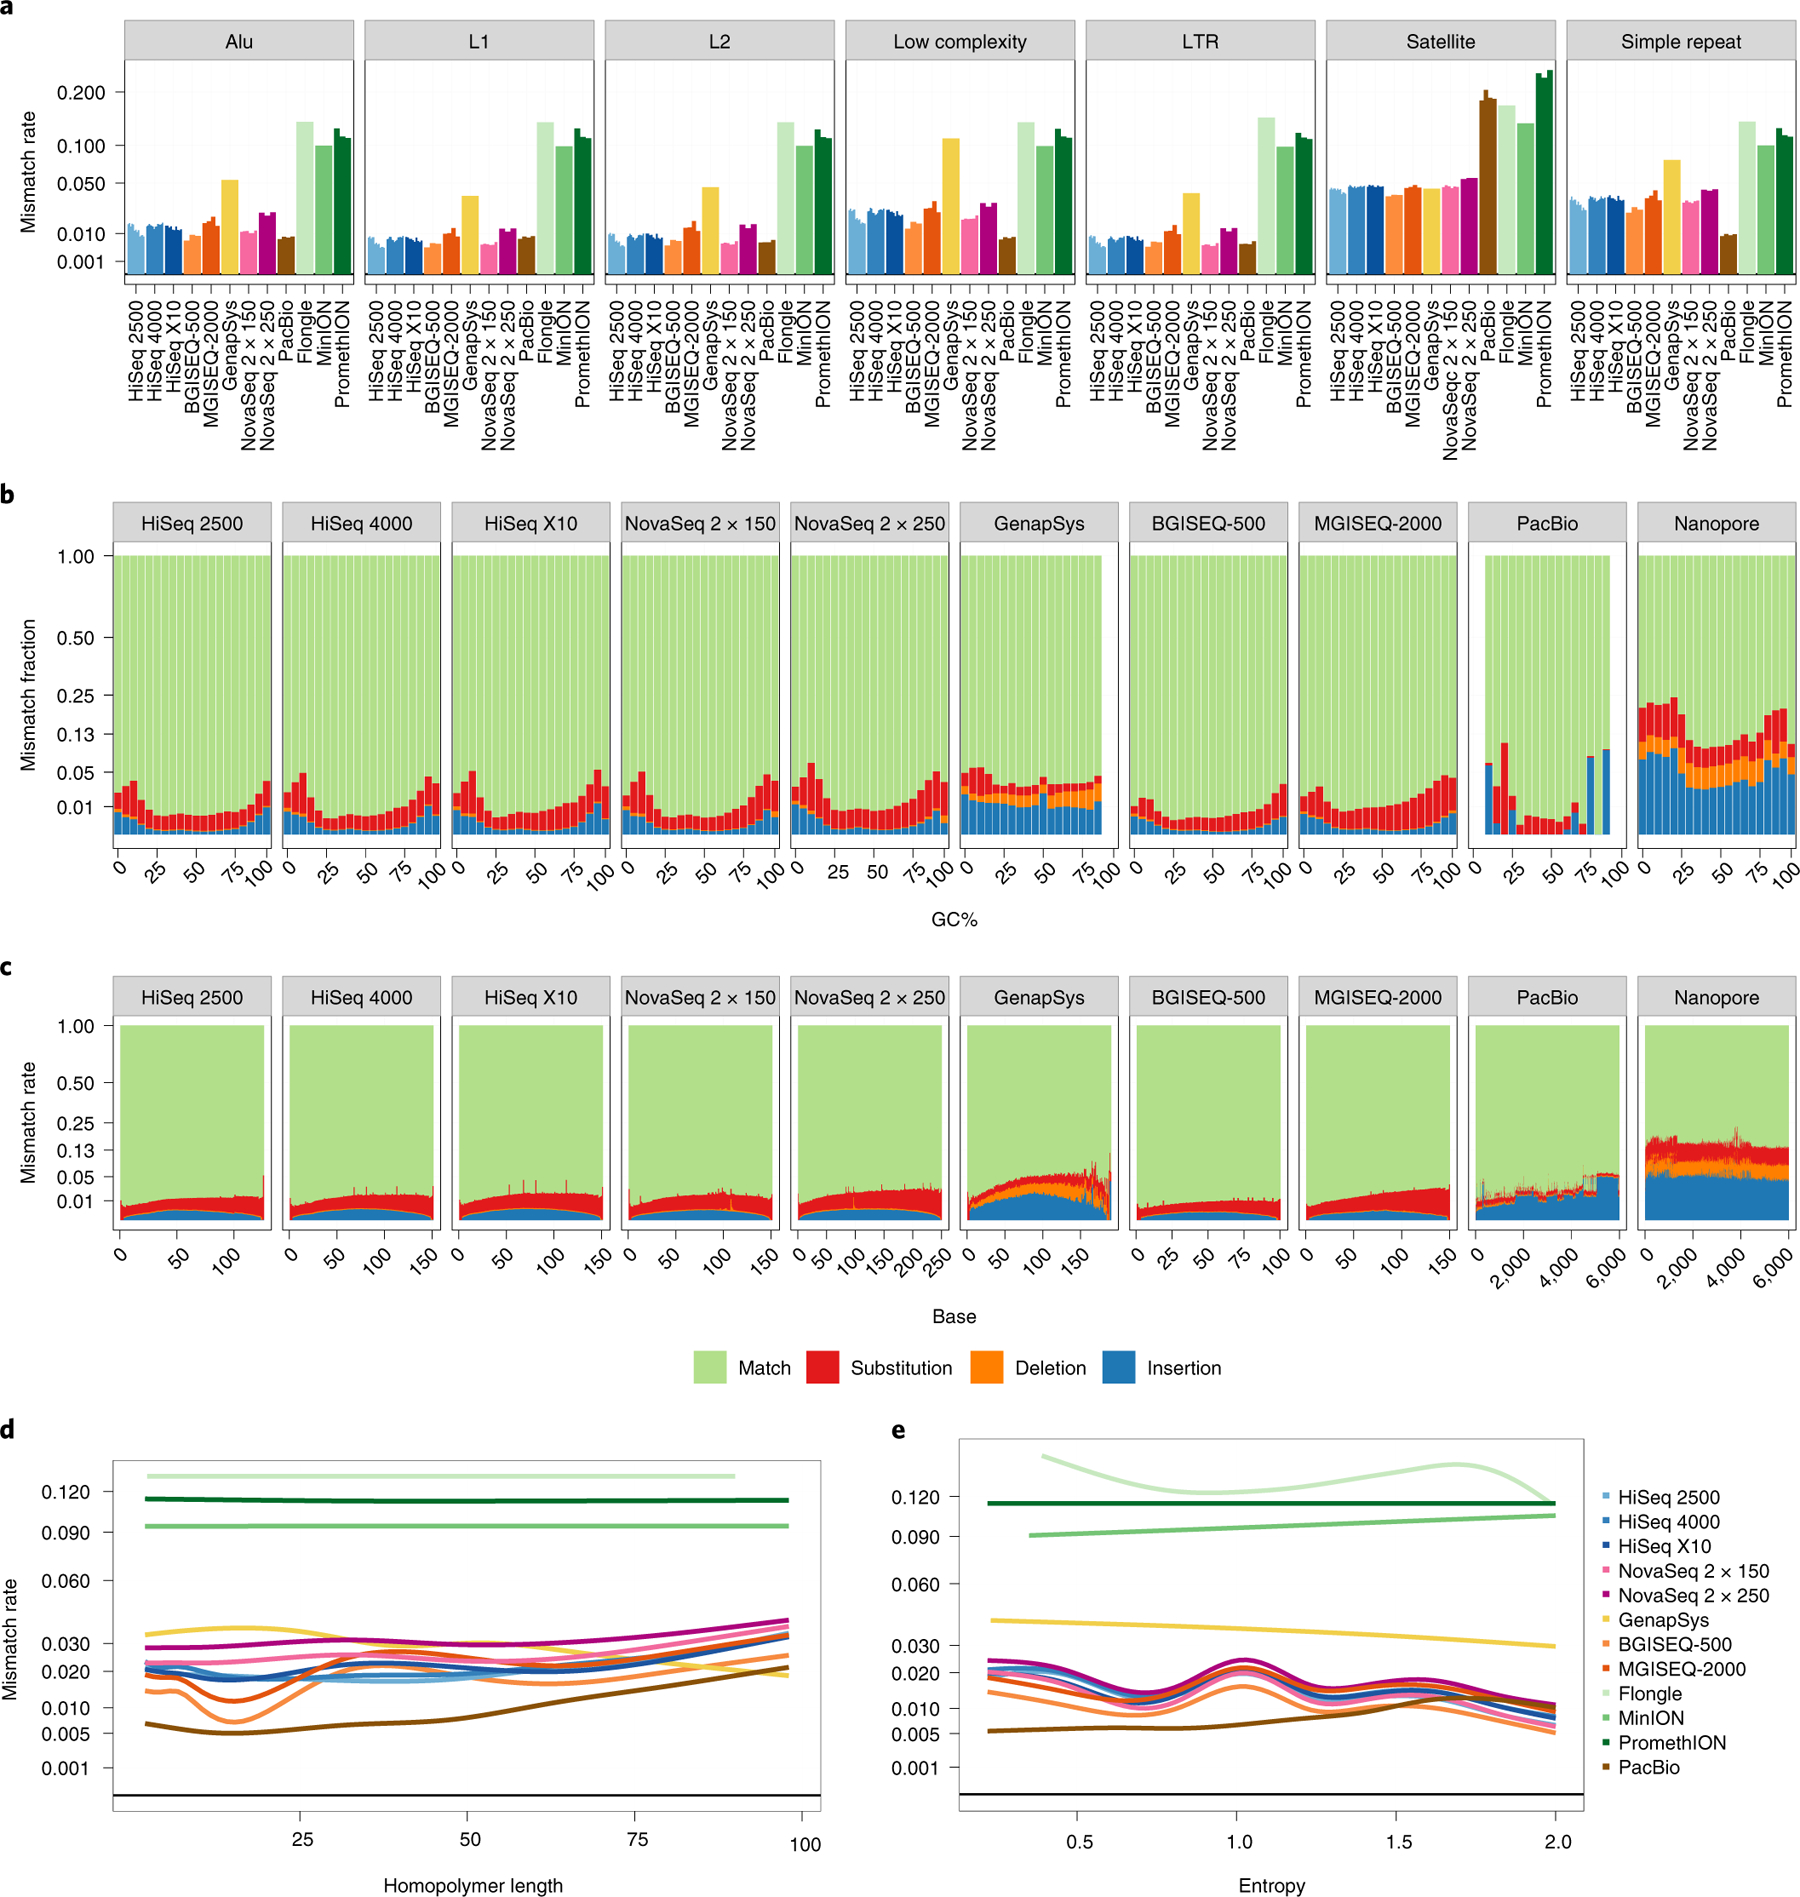
Fig. 3 |. Estimating rates of sequencing error per platform.

a, Bar plot showing total average error rate within each UCSC RepeatMasker context. Individual replicates per platform are shown as separate bars. Values are averaged across all bases covering a given context. The y axis is plotted as square root transformed. b,c, Proportional mismatch rates across GC windows (b) and base number (c). Values at each window are averaged across all reads from all replicates. For long-read platforms, read length is capped at 6 kbp. The y axis is plotted as square root transformed. d,e, Error rate in homopolymer (n = 72,687; d) and STR (n = 928,143; e) regions. In d, true homopolymers are shown at increasing copy number. In e, STRs are plotted by entropy, a measure of complexity of the motif. The y axis is plotted as square root transformed.
