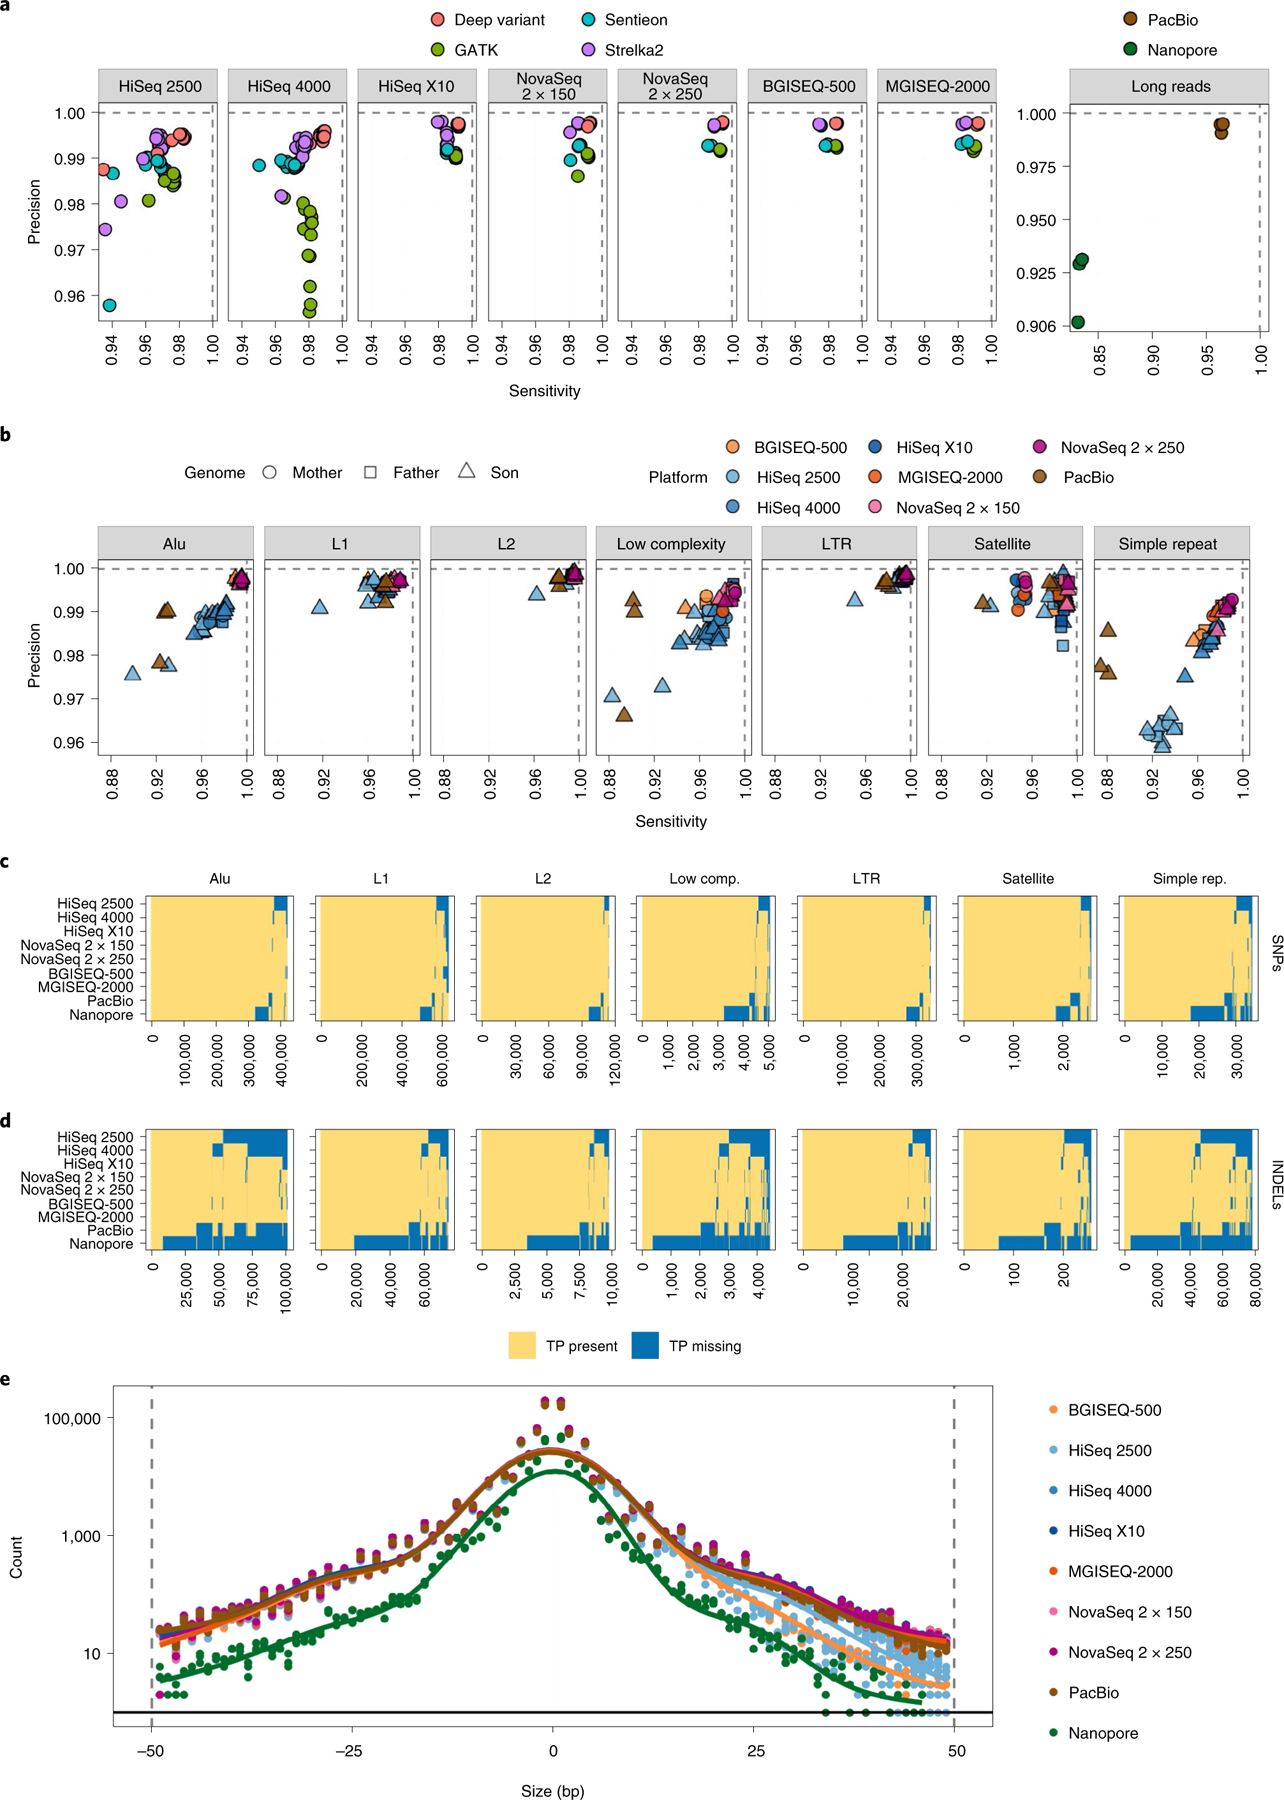
Fig. 4 |. Validating SNPs and INDEL events from short-read datasets against the GIAB high-confidence truth set as determined by RTG vcfeval.

a, Common germline haplotype variant callers were compared for each sequencing platform across the entire genome, showing the sensitivity and specificity achieved by each, for every replicate. b, Overall sensitivity and specificity plotted for variants in each UCSC RepeatMasker region, overlapped with high-confidence regions for each cell line respectively. c, Presence matrix of true-positive SNP variants within each UCSC RepeatMasker region. Each column is one variant. A yellow value indicates that the majority of replicates for that platform captured that variant, whereas blue indicates that variant was missed. d, Same as for c, but for INDELs. e, Distribution of sizes of INDELs captured per sequencing platform. Values below zero on the x axis indicate deletions; values to the right indicate insertions. Number of true-positive INDELs is plotted per mutation size and colored by platform.
