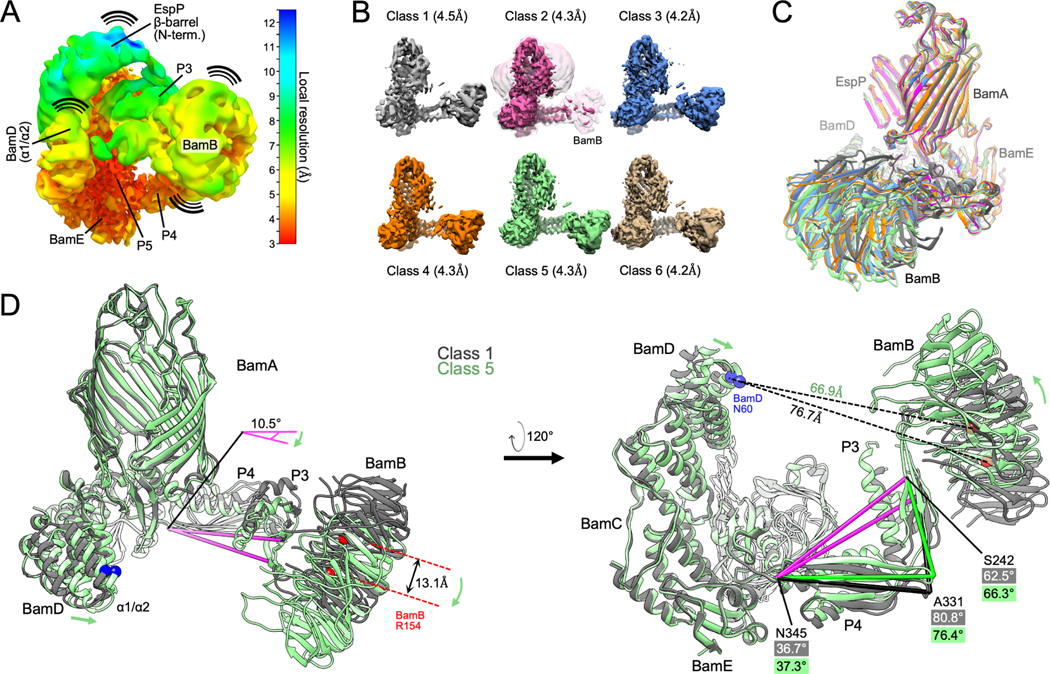
Figure 3: Conformational changes of BAM periplasmic components during OMP folding.
(A) The BAM-MBP−76EspP high-resolution map (shown in Figure 1B) filtered and colored by local resolution. Low resolution components (e.g. EspP β-barrel N-terminus, BamB, and BamA P3) are conformationally dynamic. High-resolution components (e.g. BamE and P5 are structurally stable. (B) Structurally diverse cryo-EM maps of BAM-MBP−76EspP. Maps filtered by local resolution. Class 2 also shown at a lower threshold level (clear pink) to show BamB. (C) Models of BAM-MBP−76EspP Classes 1–6 were aligned (on P5 residues Y348-R421). View shows large conformational variability in BamB positioning. Colors as in B. (D) Classes 1 and 5 aligned as in C. Conformational changes are depicted by green arrows. Axis (pink) from BamA S242 (P3) to N345 (hinge region between P4 & P5) α-carbons flexes by 10.5° between classes. Changes in the angles between S242, A331, and N345 also shows flexing between P3 and P4 between classes.

