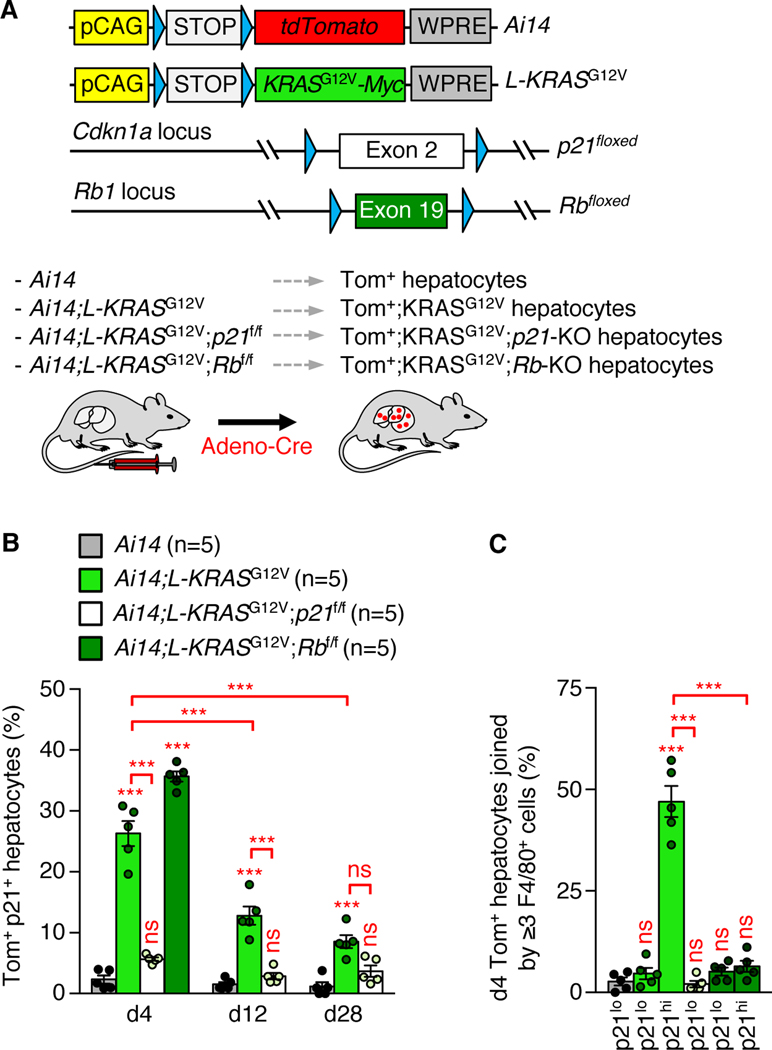
Fig. 5. p21 induced by oncogenic RAS places cells under immunosurveillance.
(A) (Top) Schematic representation of L-KRASG12V and Ai14 transgenes, and p21- and Rb-conditional knockout alleles. Blue triangles denote LoxP sites. (Bottom) Schematic of the experimental design. (B) Proportion of Tom+ p21+ hepatocytes among Tom+ hepatocytes at indicated days after adeno-Cre injection. (C) Quantification of Tom+ hepatocytes joined by ≥3 F4/80+ macrophages. p21hi, cells with elevated p21 staining; p21lo, cells with baseline or background level p21 staining. Mice used were on a C57BL/6×129Sv mixed genetic background. Data represent means ± SEM. Experiments in the above panels were performed once. ns, not significant. ***P<0.001. Two-way ANOVA with Sidak’s correction (d12 and d28 in B), one-way ANOVA with Sidak’s correction (d4 in B and C).

