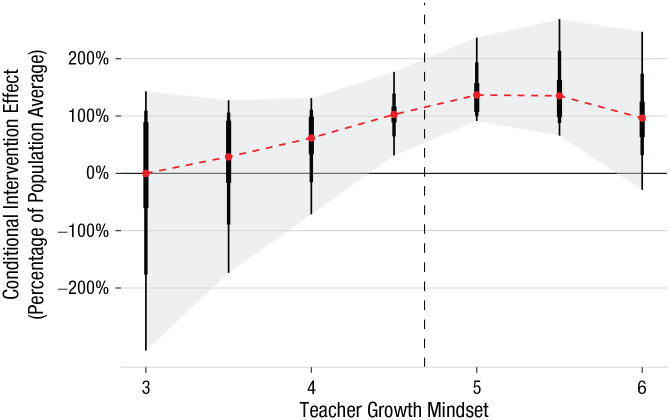
Fig. 2.
Evidence for the mindset-plus-supportive-context hypothesis regarding teacher mindsets and a student-mindset intervention—up to a point—in a flexible Bayesian causal-forest model. Posterior distributions are of the conditional average treatment effect (CATE) as a proportion of the average treatment effect (ATE). Thus, 100% means that the CATE is equal to the population ATE. Red dots represent the estimated intervention effect (posterior means) at each level of teacher mindset. The widths of the bars, from wide to narrow, represent the middle 50% (i.e., interquartile range), 80%, and 90% of the posterior distribution, respectively. The teacher-mindset measure ranges from 1 to 6. The dashed vertical line represents the population mean for teacher mindsets. However, the x-axis stops at 3 because only five teachers had a mindset score below this, and the model cannot make precise predictions with so few teachers.

