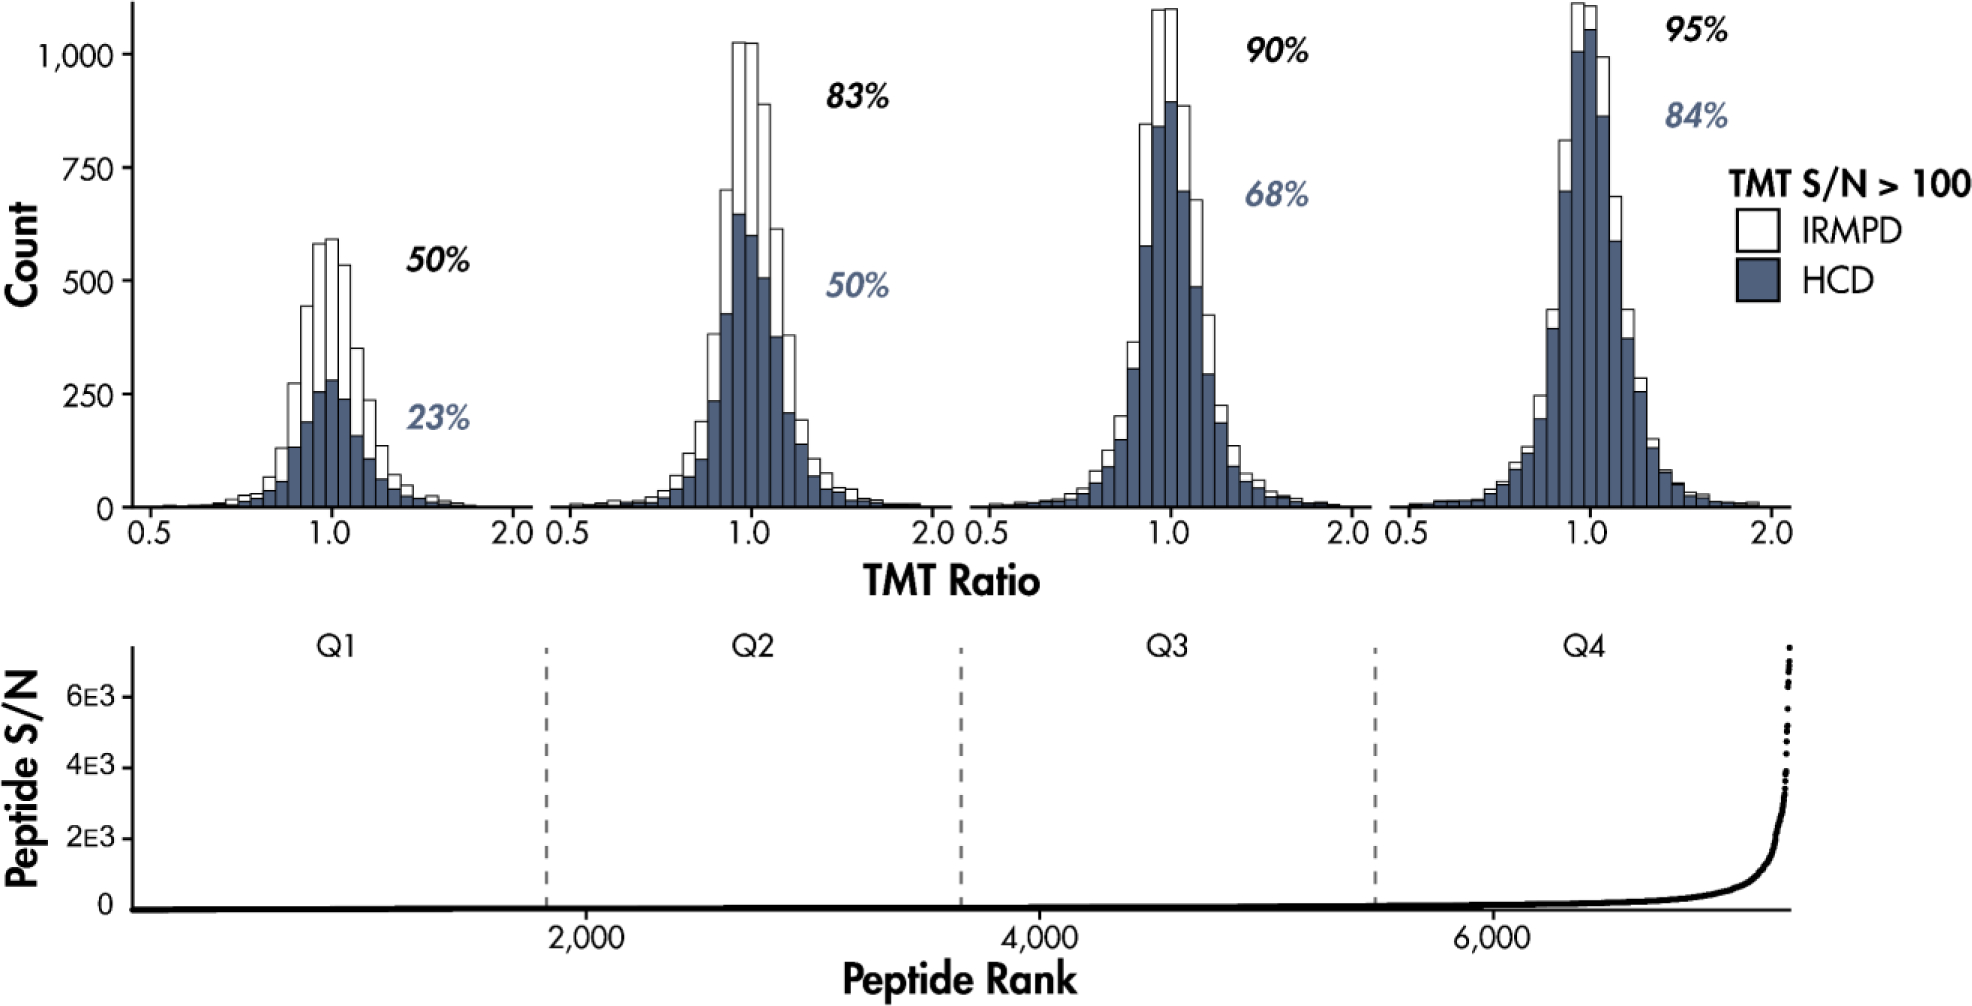
Figure 5.

Identified PSMs plotted against their S/N and divided into four quartiles. Each quartile has histograms that illustrate the spread of ratios among TMT reporter ion channels for PSMs with an average TMT S/N greater than 100. Ratios were determined by calculating the average TMT reporter signal-to-noise of each gene knockout variant (WT, Δhis4, Δmet6, and Δura2) and dividing these averages by the average of the other TMT channels. MS3 activation method is indicated by bar color. The percentage of PSMs that exceed the S/N cut-off of 100 using each activation method are shown in each quartile.
