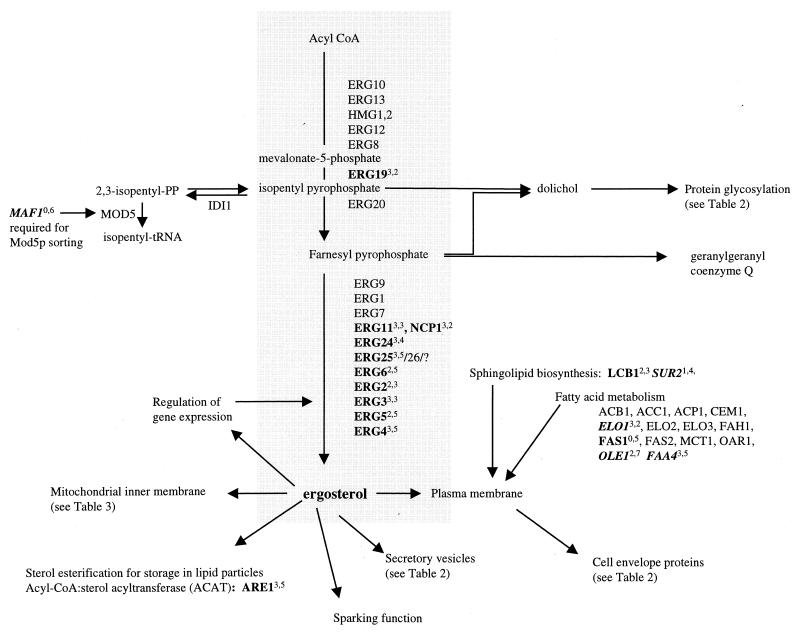
FIG. 2.
Genes involved in the biosynthesis of ergosterol and membrane components. Boldfaced genes were responsive in the study; boldface italics indicate genes with decreased transcript levels. Superscripts indicate the number of treatments to which the gene responded. The first number in each superscript is the number of genetic perturbations (out of a total of three) which elicited a response, and the second number is the number of drug treatments (out of a total of eight) which elicited a response. Lists of genes were obtained from the YPD (18) and reference 9.

