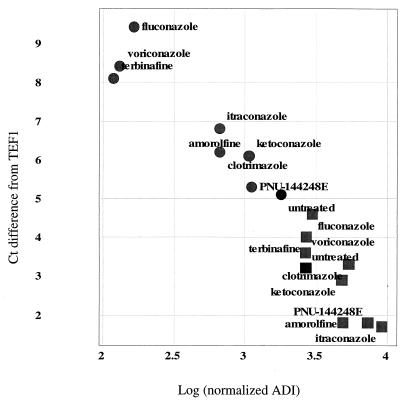
FIG. 4.
Comparison of expression measurements by RT-PCR and microarrays. Each data point represents the measurement of a given gene by each method under a specific treatment, as indicated by the label. Squares, ERG25; circles, YER067W; solid symbols, untreated control. The vertical axis is the change from the TEF1 level; larger numbers signify more cycles needed and thus less starting material in the sample. The horizontal axis indicates the microarray intensity in ADI units, normalized as described in Materials and Methods; ADI units are proportional to transcript levels.

