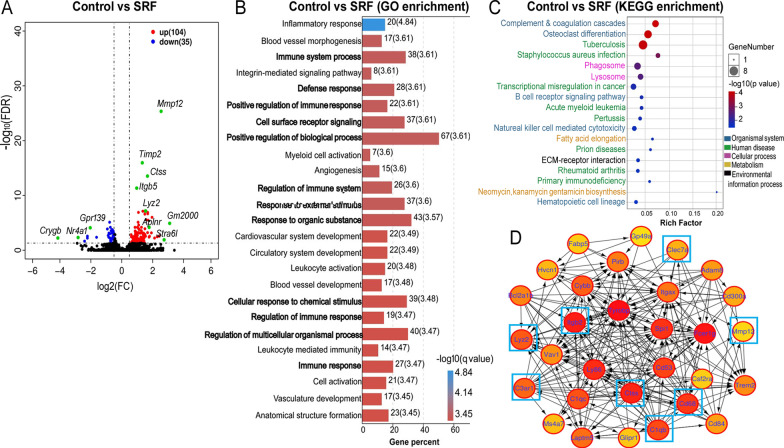
Fig. 1.
RNA-seq transcriptome of RPE/choroid from control and subretinal fibrosis mice. RNA-seq was conducted in RPE/choroidal tissue from control and subretinal fibrosis mice. The differentially expressed genes (DEGs) were identified as FDR < 0.05, log2(fc) ≥ 0.5, and count > 50 in at least 2 samples. A Volcano plot showing the comparison of DEGs from control and subretinal fibrosis mice. The green dots represent the most significantly regulated genes. n = 3 mice in each group. B The top 25 enriched functions from GO analysis of DEGs. Bold font indicating the significantly enriched GO terms that Mmp12 is involved in. Numbers beside the bar indicate the number of DEG and q value (in bracket). C DEG enriched pathways from KEGG analysis. D The network image shows the top 30 highest degree genes calculated by the Cytohubba plugin of Cytoscape. The eight genes (blue boxes) were selected for further qRT-PCR verification

