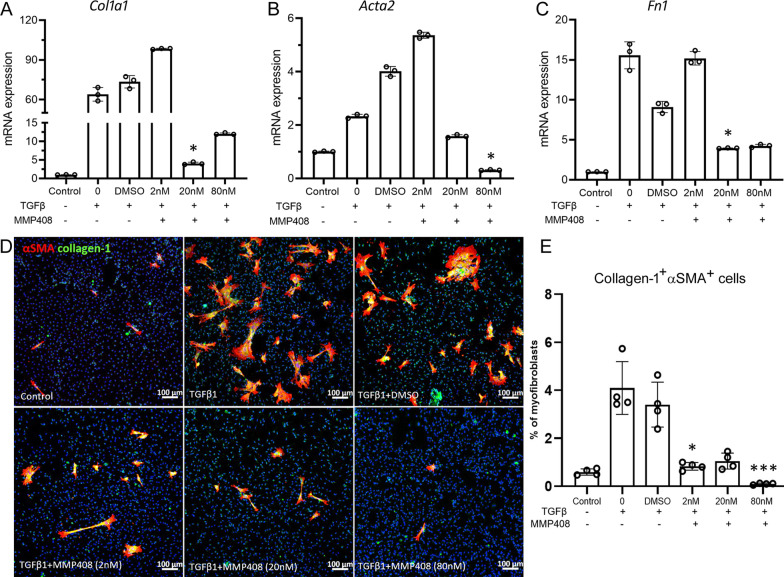
Fig. 5.
The effect of MMP408 on macrophage-to-myofibroblast transition (MMT). BMDMs from normal mice were treated with TGFβ1 (10 ng/ml) with or without different concentrations of MMP408 (2 nM/ml, 20 nM/ml and 80 nM/ml) or DMSO for 96 h. Cells were collected for qRT-PCR or immunocytochemistry. A–C The mRNA expression levels of Col1a1 (A), Acta2 (B) and Fn1 (C). Mean ± SD, n = 3, *p < 0.05 compared with DMSO group. Kruskal–Wallis with Dunn’s multiple comparisons test. D Representative confocal images of BMDMs stained for α-SMA (red) and collagen-1(green) from different treatment groups. Scale bar = 100 µm. E Dot/bar figure showing the percentages of collagen-1+ α-SMA + cells in different groups. Mean ± SD, n = 4, **p < 0.01, ***p < 0.001. Kruskal–Wallis with Dunn’s multiple comparisons test

