Figure 2.
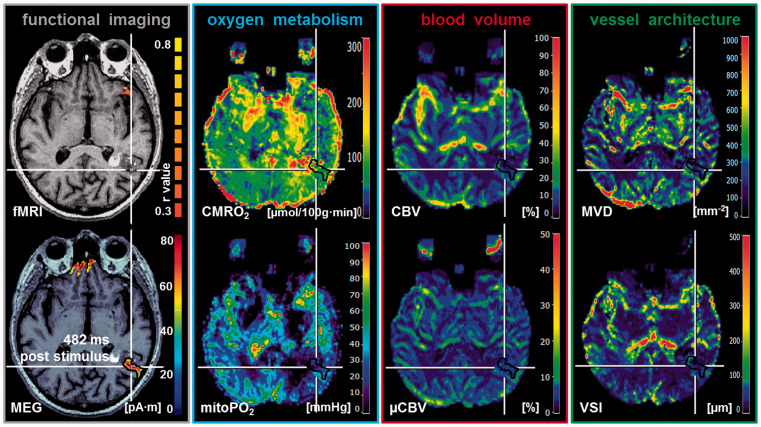
Multimodal imaging in a 73-year-old patient suffering from a Cav (ID 11 in Table 1) with impaired NVC in a cortical area for language function (posterior superior temporal sulcus (STS) extending into Brodmann’s area 39). From left to right: BOLD fMRI-based cortical localizations superimposed onto axial T1w MRI data showed missing BOLD response when compared with MEG-based cortical localizations of language functions (482 ms poststimulus). MR imaging biomarker maps revealed alterations in oxygen metabolism (high CMRO2 and low mitoPO2) due to restrictions in cerebral blood volume (decreased CBV and µCBV) and microvascular architecture (decreased MVD and VSI) compared to the contralateral side to the lesion. Note: White lines indicate the slice intersections; black contour lines are the ROIs for data analysis; color coding bars are positioned on right-hand side of corresponding image. For the fMRI image, the color coding bar represents the correlation coefficient (r value).
fMRI: functional magnetic resonance imaging; MEG: magnetoencephalography; CMRO2: cerebral metabolic rate of oxygen; mitoPO2: mitochondrial oxygen tension; CBV: cerebral blood volume; µCBV: microvascular cerebral blood volume; MVD: microvessel density; VSI: vessel size index.

