. 2022 Feb 18;13(14):3965–3976. doi: 10.1039/d1sc06182h

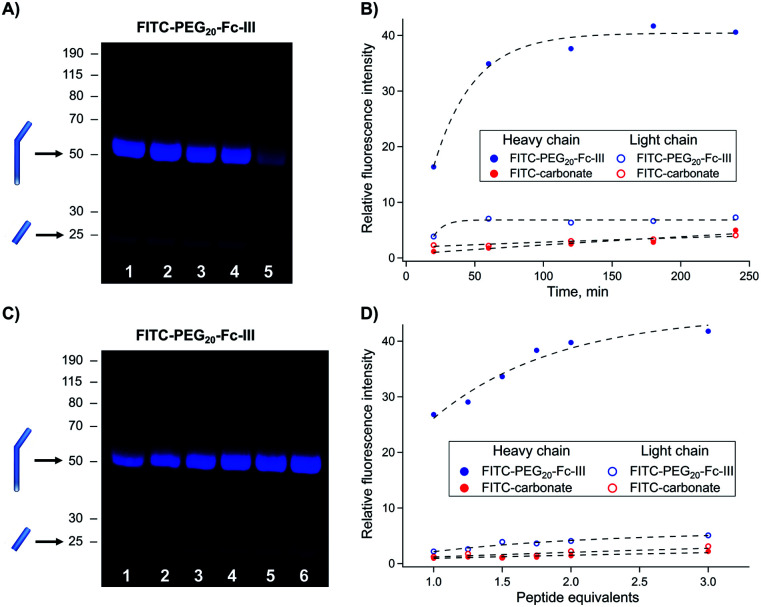
Fig. 3. Optimization of the reaction conditions for trastuzumab conjugation with FITC-PEG20-Fc-III. (A and C) SDS gel electrophoresis of fluorescently labeled antibody obtained after increasing the incubation time (top panel) and peptide equivalents (bottom panel). Derivatized mAbs were run under the reducing conditions, and fluorescence was measured using the FluoroM bio-imaging system. The bands next to the 50 and 25 kDa marker correspond to Hc and Lc, respectively. (B and D) Quantification of the band fluorescence intensities of the SDS gels of panels A and C, respectively. The incubation time and peptide equivalents of each band of panels A (from right to left) and C correspond to the data points of panels B and D , respectively (Fig. S2). The FITC-carbonate data (B and D) were extracted from the gels in Fig. S2..

Fig. 3