. 2022 Mar 16;13(14):4150–4169. doi: 10.1039/d2sc00841f

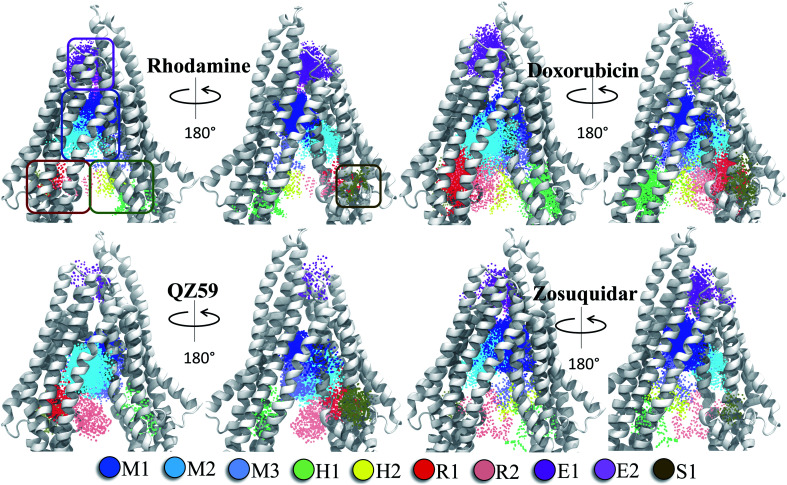
Fig. 6. Clustering of binding modes generated by docking. Clustering of the binding modes for 4 representative compounds to the extended ensemble of Pgp is shown (the results for other compounds are shown in Fig. S12). Only one representative, IF-like conformation of the protein is shown here for clarity. The main binding sites in the TMDs are marked by colored rectangles (different shades of blue: modulator or M site; green and yellow: hoechst-binding or H site; red and salmon: rhodamine-binding or R site; purple: extracellular or E site; brown: subsidiary or S site) shown for the first representative compound (rhodamine). Binding clusters (or binding subsites) within the main binding regions are highlighted with colored points (as indicated in the legend at the bottom), representing the heavy atoms of the clustered binding modes (E3 and S2 sites are not shown as they may not represent sites important for substrate binding/transport). The density of points in each cluster represents the cluster population. M1 and M2 subsites at the apex of the TMDs show the highest cluster populations in all compounds.

Fig. 6