. 2022 Mar 16;13(14):4150–4169. doi: 10.1039/d2sc00841f

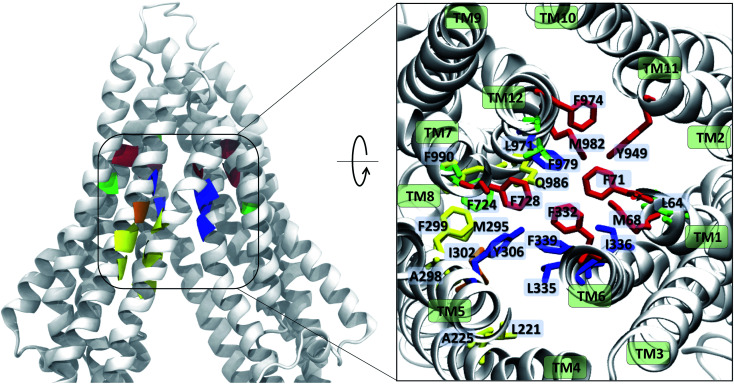
Fig. 9. Ligand binding residues identified in Pgp. Binding residues in Pgp showing the highest (top 10) interaction frequencies (from Fig. 8 and S14) with the tested compounds are shown in color within a cartoon representation of the protein backbone (left) and in stick representation (inset, right). The TM helices are individually labeled in the inset. The binding residues common to all compounds are shown in blue, residues common to binding of small substrates/high-affinity modulators in red, residues common to low-affinity modulators/large substrates in yellow, those common to small substrates/low-affinity modulators in orange, and residues showing preference for only small substrates are shown in green. High-affinity modulators share all binding residues with small substrates and show binding preference for the M1 subsite, whereas low-affinity modulators and large substrates show binding preference for residues forming the M2 subsite, lying below the M1 subsite and partially overlapping with it.

Fig. 9