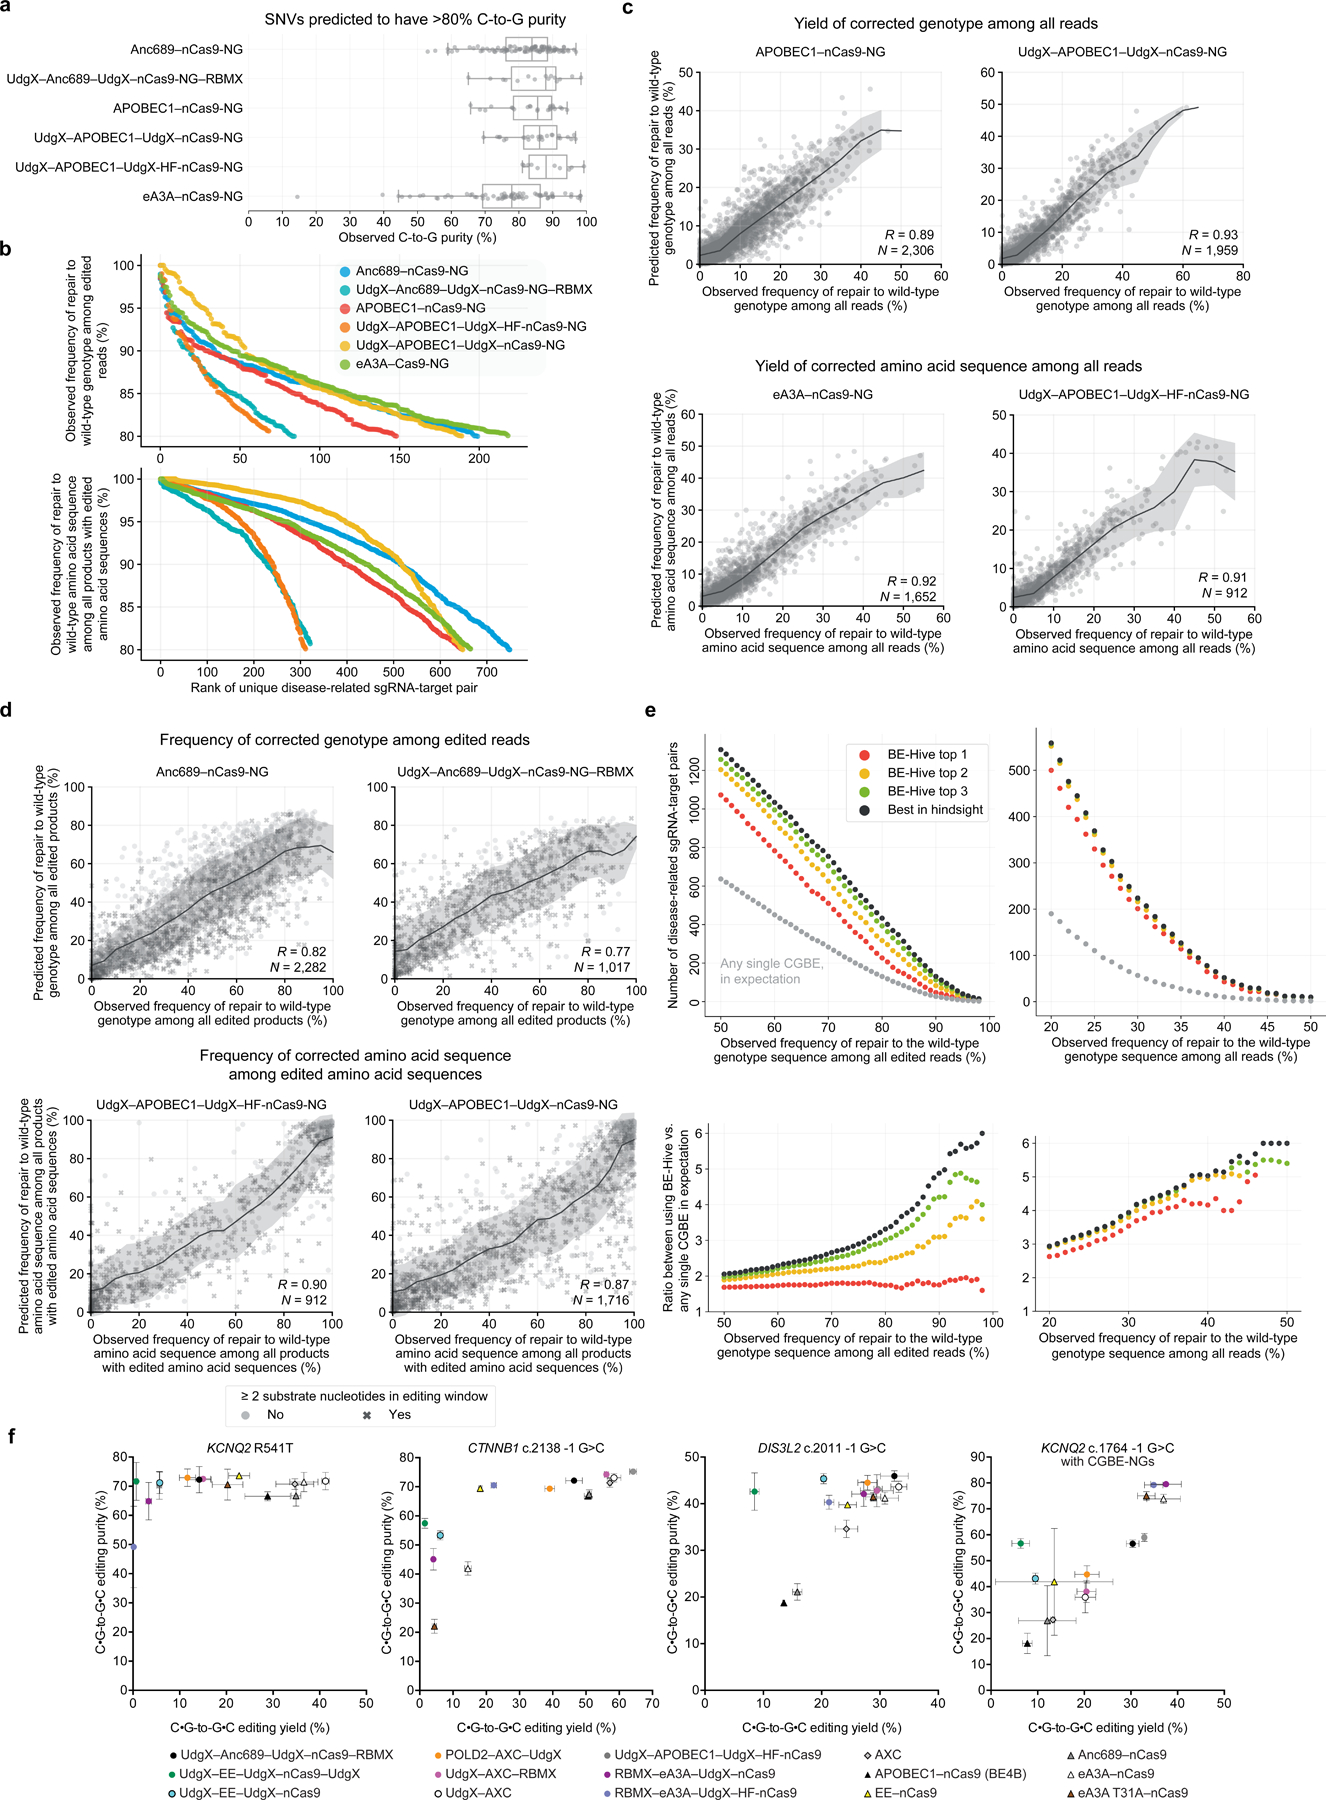
Figure 6. Target library characterization and machine learning modeling of CGBE variants.

(a) Observed C-to-G purity by CGBE at SNVs predicted to have >80% C-to-G purity. Box plot indicates median and interquartile range, and whiskers indicate extrema. (b) Observed number of disease-related sgRNA-target pairs corrected at varying genotype precision and amino acid precision thresholds by various strategies for selecting CGBEs. See Supplementary Table 3. (c) Comparison of predicted versus observed correction yield of disease-related transversion SNVs in mES cells. Trend lines and shading show the rolling mean and standard deviation. (d) Comparison of predicted versus observed correction precision of disease-related transversion SNVs in mES cells. Trend lines and shading show the rolling mean and standard deviation. (e) Observed number of sgRNA-target pairs containing disease-related transversion SNVs corrected at various thresholds for genotype and amino acid precision. (f) Installation of disease-associated SNPs using CGBEs.
