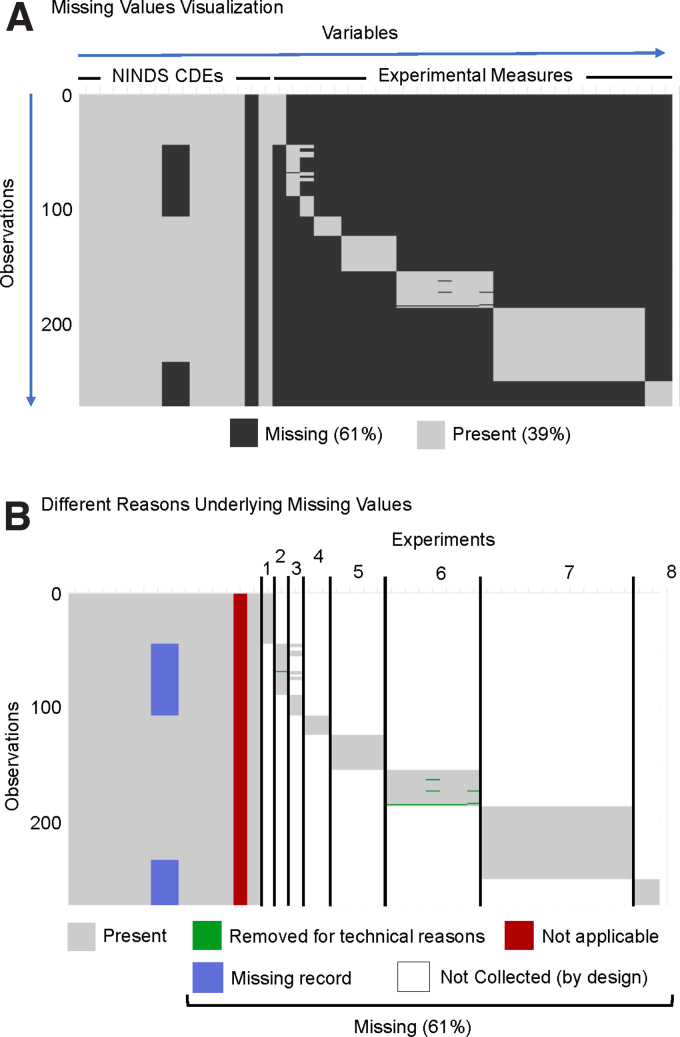
FIG. 3.
Missing value visualizations of Chou and colleagues (2018).33 (A) Typical missing value visualization shows which elements (i.e., cells) contain a value and which do not, which are thus termed missing. The uploaded data showed generally low missingness for variables (i.e., columns) corresponding to NINDS CDEs and fairly high missingness for variables corresponding to collected experimental measures. Each row corresponded to an observation, in this case a single animal subject. (B) Types of missingness were manually color-coded based on the type of missingness. The majority of the missing values were “Not Collected (by design)”; the data set constituted eight separate experiments, and experimental outcomes were specifically collected for subjects belonging to one experiment. The result was an extremely sparse data set by design. Another source of missingness was when a variable is “Not applicable,” which we expect in cases when a NINDS-defined CDE is not applicable to the study design. In this example, no treatments were given, so the treatment CDE column was entirely missing values. Data could also be irrecoverable because of “Missing records,” such as the subject's sex in this example and as reflected in Figure 2B. Last, data from experiments could also have been “Removed due to technical reasons.” CDEs, Common Data Elements; NINDS, National Institute of Neurological Disorders and Stroke.

