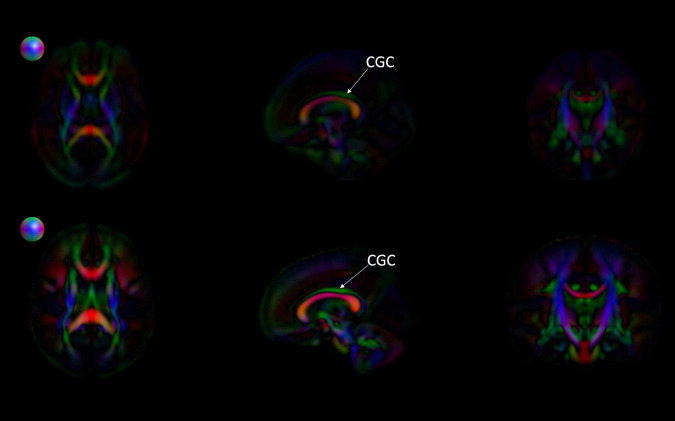
FIGURE 8.
Comparing the EBDS neonatal and pediatric atlases. The images are the color-encoded orientation FA maps in axial, sagittal, and coronal slices. The top images are the neonatal atlas, and the bottom images are the pediatric atlas. From the sagittal view, we can observe that the cingulum (CGC) has higher FA due to the greater degree of myelination in the pediatric atlas. Furthermore, given the significantly lower SNR in the neonate DTI, its atlas appears less sharp than the pediatric DTI atlas. Spheres next to the axial view of atlases represent color coding for directional information.

