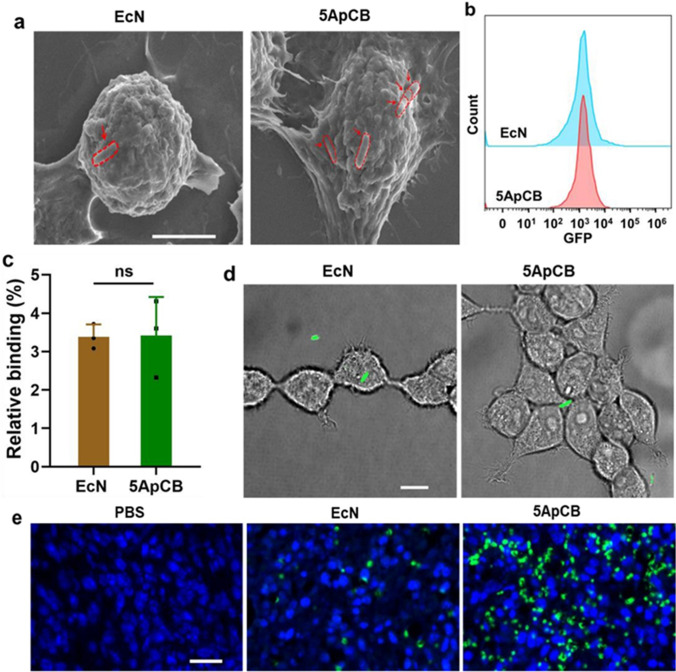
Fig. 4.
(a) SEM images of 4 T1 cells after incubation with ApCB and EcN cell, bacteria is circled by red dotted lines (b and c) Flow cytometric analysis of 293 T cells after co-incubation for 2 h with EcN and 5ApCB (error bar represent standard deviation at n = 3 independent experiments), Student’s t test (two-tailed), ns- no significance, (d) LSCM images of 293 T cells after incubation with EcN and 5ApCB, green colour denote green fluorescent protein production in EcN (e) Confocal images of tumour tissues sectioned at 12 h after intravenous injection of bacteria. Blue and green colour indicate nuclei stained with 4′,6-diamidino-2-phenylindole and EcN stained with FITC-labelled anti-Escherichia coli, respectively. The adopted figure is under common creative licence and used with permission from Geng et al. (58).

