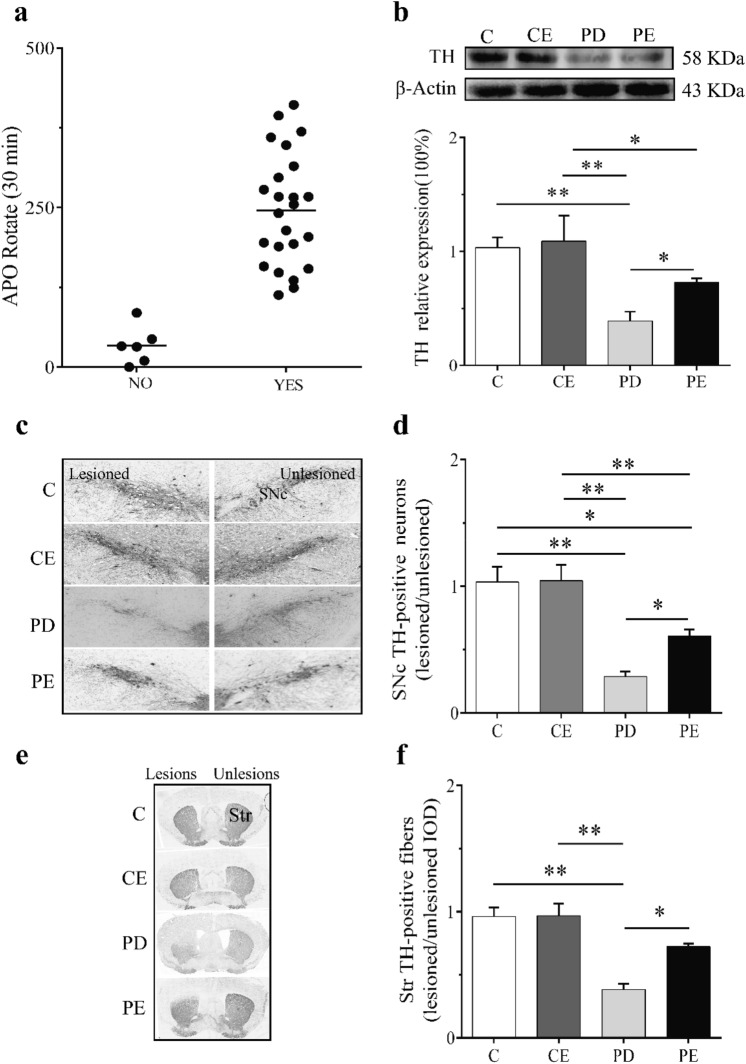
Fig. 3.
The schematic diagram to verify the results of PD mouse models. a Diagram of 6-OHDA-treated mice rotated for 30 min by APO. b The schematic diagram of TH protein expression in the striatum was compared with that in the striatum of each group. c Schematic diagram of expression of TH-positive neurons in substantia nigra (200 ×). d The expression of TH-positive cells in substantia nigra of mice in each group. e Schematic diagram of TH-positive nerve fiber expression in dorsal striatum area (100 ×). f The expression of TH-positive nerve fibers in the striatum of mice in each group. **P < 0.01. *P < 0.05

