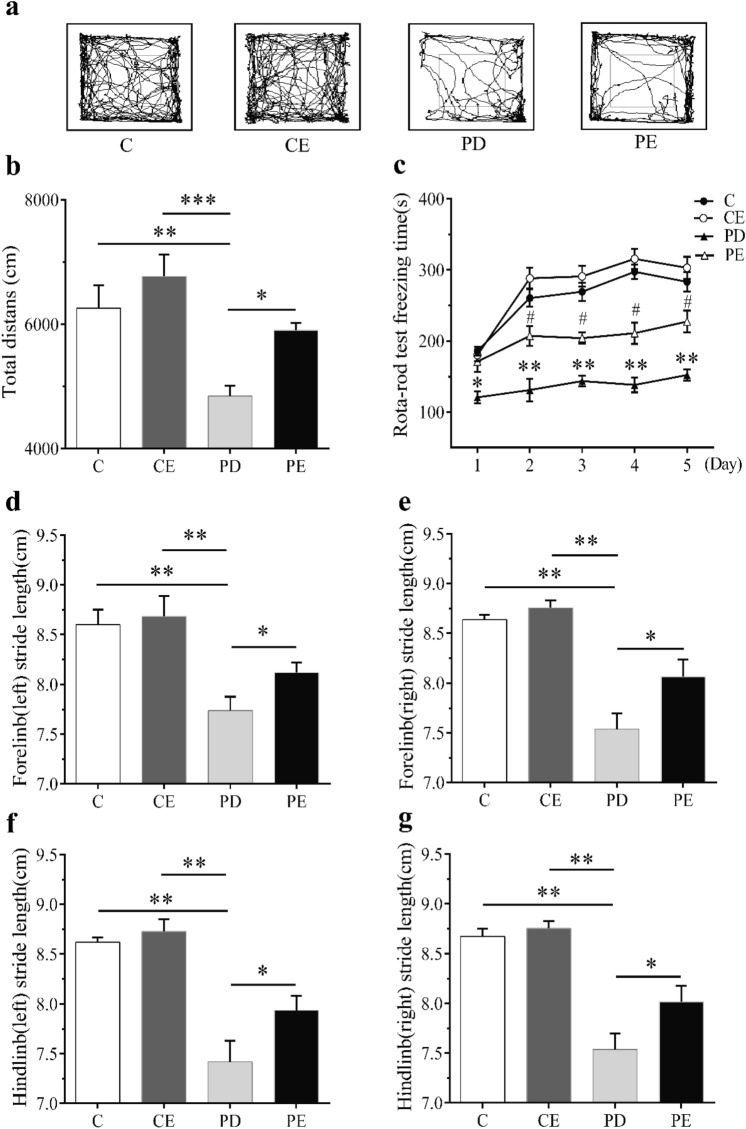
Fig. 4.
The statistical results of open-field total distance, gait test, and rotating rod test. a Track diagram of open-field moving distance. b After 4 weeks of aerobic training, the distance of mice in each group in the open field was compared. c After 4 weeks of aerobic training, the maintenance time of mice in each group on the rotating rod was compared. d Comparison of left forelimb movement steps of mice in each group after 4 weeks of aerobic training. e After 4 weeks of aerobic training, the moving steps of the right forelimb of mice in each group were compared. f After 4 weeks of aerobic training, the moving steps of the left hindlimb of mice in each group were compared. g After 4 weeks of aerobic training, the moving steps of the right hindlimb of mice in each group were compared.*P < 0.05, **P < 0.01, c: comparison between PD and C, *P < 0.01, **P < 0.01; compared with PD and PE, #P < 0.05

