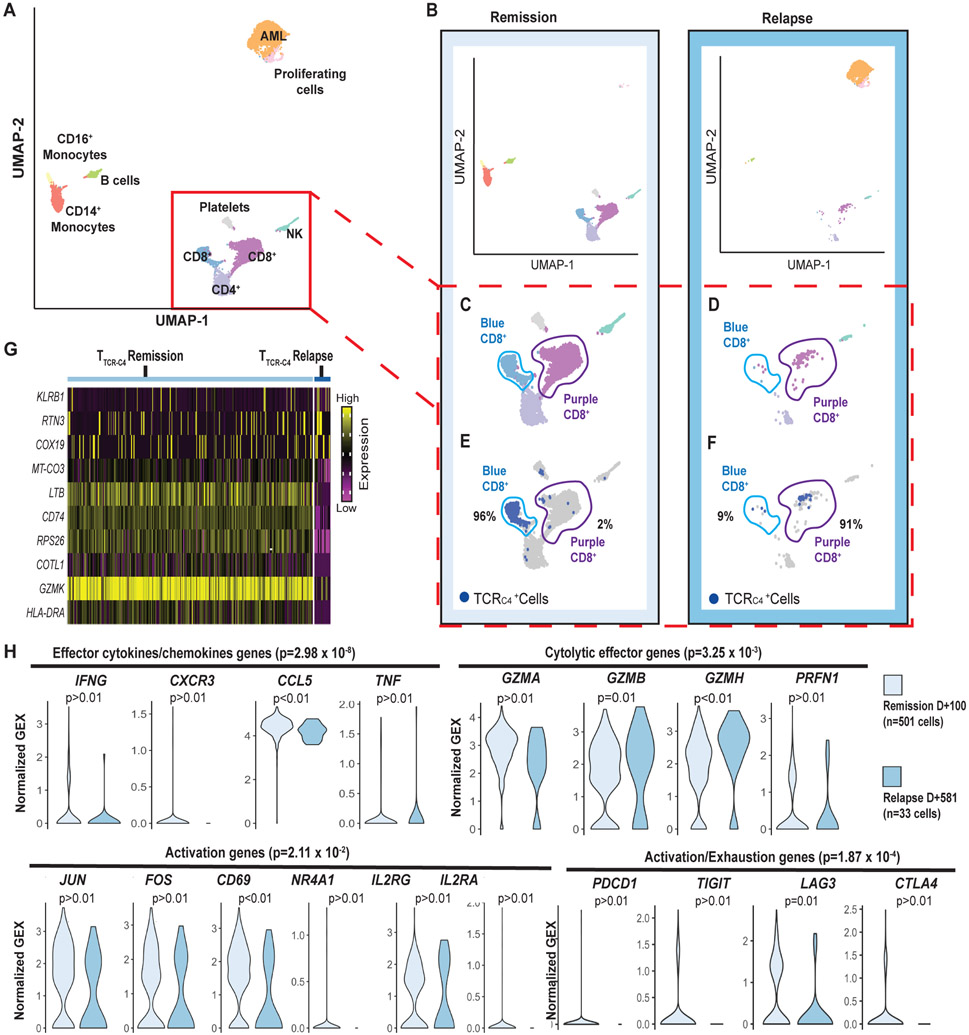
Fig. 2: TTCR-C4 present an activated transcriptional profile during remission but not during relapse.
(A) UMAP visualization of PBMCs from both the remission (100 days after 1st infusion) and relapse (110 days after the second infusion or 581 days after the 1st) (red dotted lines Fig. 1A) samples are visualized together (see Supplementary Methods). PBMCs (n=7704) clustered into populations as indicated by labels. Clustering biostatistical analysis is described in Supplementary Methods and representative marker genes are shown in fig. S3. (B) UMAP visualization of the separated PBMCs obtained at remission (left) and relapse (right). (C) Close-ups are shown for clusters containing T cells during remission with identification of two (light blue and purple) distinct CD8+ T cell clusters based on their transcriptional programs. (D) Close-ups are shown for clusters containing T cells during relapse revealing the CD8+ T cells are predominantly in the purple cluster. (E) Localization of TTCR-C4 (dark blue dots) cells during remission is shown. (F) Localization of TTCR-C4 (dark blue dots) cells during relapse is shown. Percentage of the total TTCR-C4 cells in each cluster are indicated. (G) The heat map shows the 10 most differentially expressed genes (DEG) comparing TTCR-C4 during remission (n=501) to those during relapse (n=33). (H) Analysis of gene-sets representing effector cytokines, cytolytic effector genes activation, and exhaustion genes were compared in TTCR-C4 during remission (light blue) and relapse (darker blue), with each transcript in the gene-set shown as a violin plot. The shape of the violin displays frequencies of values. Model-based Analysis of Single Cell Transcriptomics (MAST) was used to determine the significance shown above each plot. Significance thresholds were set a priori at a threshold of false discovery rate of 5% and positive or negative fold change > log2(1.5).

