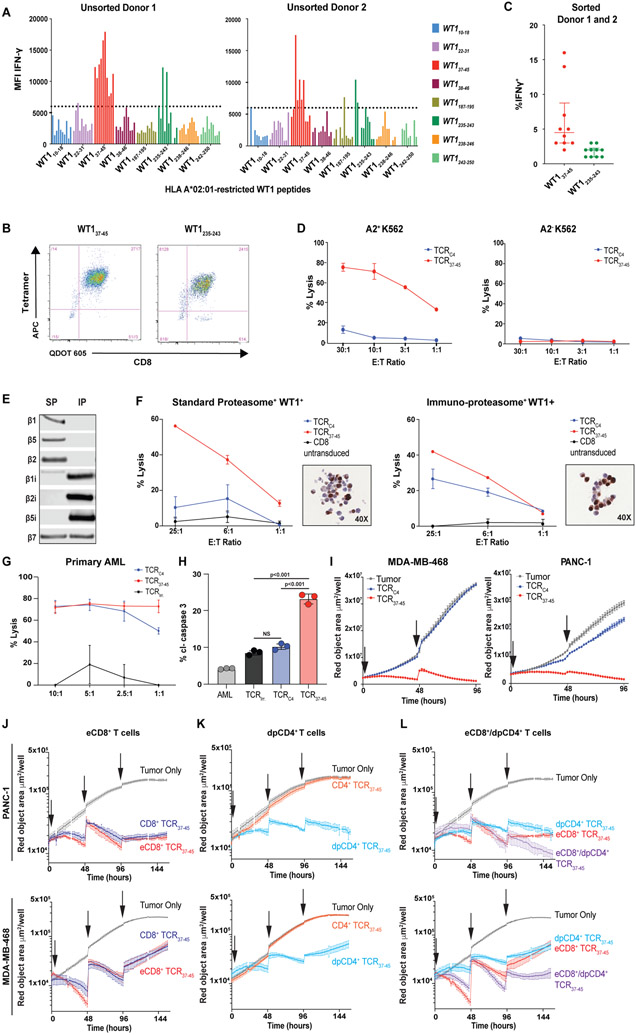
Fig. 5: Identification of an alternate HLA-A*02:01-restricted WT1 peptide (WT137-45 ) which is not dependent on immunoproteasome processing.
(A) Ten CD8+ T cell lines from 2 HLA-A*02:01-expressing healthy donors were generated against 8 candidate HLA-A*02:01-binding WT1 peptides (x-axis). Each cell line’s ability to produce IFN-γ following stimulation with the immunoproteasome-deficient but WT1+ HLA-A*02:01-transduced K562 cell line at an E:T of 1:1 was assessed. Peptides were considered to have elicited high reactivity from donor T cells as measured by MFI (above the arbitrary threshold of 6000) for the IFN-γ positive cells. (B) Representative flow plots show CD8+ T cell lines targeting WT137-45 or WT1235-243 that were sorted using the corresponding tetramers. (C) Sorted T cell lines targeting WT137-45 had the highest comparative reactivity, assessed by IFN-γ MFI, when cultured with HLA A*02:01-tansduced K562 cells. TCRs targeting WT137-45 were isolated from T cells in these lines. Data are presented as median with the interquartile range. All data points are shown. (D) Lysis of K562 ± expression of HLA-A*02:01 by CD8+ T cells from a healthy donor transduced with TCRC4 or a TCR targeting WT137-45 (TCRWT1-37-45 #1) confirmed that expression of the WT137-45 peptide was not dependent on IP processing. Error bars show standard deviation of triplicate wells. (E) The immunoblot shows protein expression of catalytic proteasome subunits in HEK-293 (endogenous SP expression) ± engineering to express the IP. (F) Percent lysis (y-axis) is shown for IP/SP-skewed HEK-293 cells lines by CD8+ T cells transduced to express either TCRC4 (blue lines), TCR37-45 (red lines) and untransduced CD8+ T cells (black lines) at indicated effector to target (E:T) ratios (x-axis). Inset depicts WT1 IHC of IP/SP HEK-293 cells transduced with WT1-and HLA-A*02:01. IP/SP cell lines demonstrate heterogeneity of WT1 expression. Error bars show standard deviation of triplicate wells. (G) Percent lysis (y-axis) of a primary leukemia by CD8+ T cells transduced to express either an irrelevant TCR (TCRirr.; black lines), TCRC4 (blue lines) or TCR37-45 (red lines) is shown. (H) Percent AML cells expressing cleaved caspase 3 (cl-caspase 3, y-axis) is shown for Patient 1’s relapsed AML either alone (gray) or cultured with CD8+ T cells with the endogenous TCR removed using CRISPR-Cas9 and transduced to express TCRirr. (black), TCRC4 (blue), or TCR37-45 (red). Error bars show standard deviation of triplicate wells. (I) Growth kinetics are shown for WT1+ cell lines PANC-1 and HLA-A*02:01-transduced MDA-MD-468 in live tumor-visualization assay in the absence (gray lines), or presence of CD8+ T cells transduced to express either TCRC4 (blue lines) or TCR37-45 (red lines). Effector to target (E:T) ratio of 10:1 was used and arrows indicate addition of tumor cells to culture. Standard error of triplicate wells are shown. (J to L) Growth kinetics are shown for WT1+ cell lines PANC-1 and HLA-A*02:01-transduced MDA-MB-468 in live tumor-visualization assay in the absence (gray lines), or presence of TTCR37-45 cells. (J) CD8+ T cells were transduced with only TCR37-45 (light-blue line) or a poly-cistronic construct containing TCR37-45 and CD8αβ (red line, eCD8+). (K) CD4+ T cells were transduced with only TCR37-45 (blue line) or a poly-cistronic construct containing TCR37-45 and CD8αβ (green line, dpCD4+). (L) A comparison of eCD8+ alone (red line), dpCD4+ alone (green line) or eCD8+/dpCD4+ in combination (1:1 ratio, purple line) is shown. For all conditions, arrows indicate addition of tumor cells to culture. Standard error of triplicate wells are shown. 4:1 E:T ratio, total T cells was kept consistent for all conditions.

