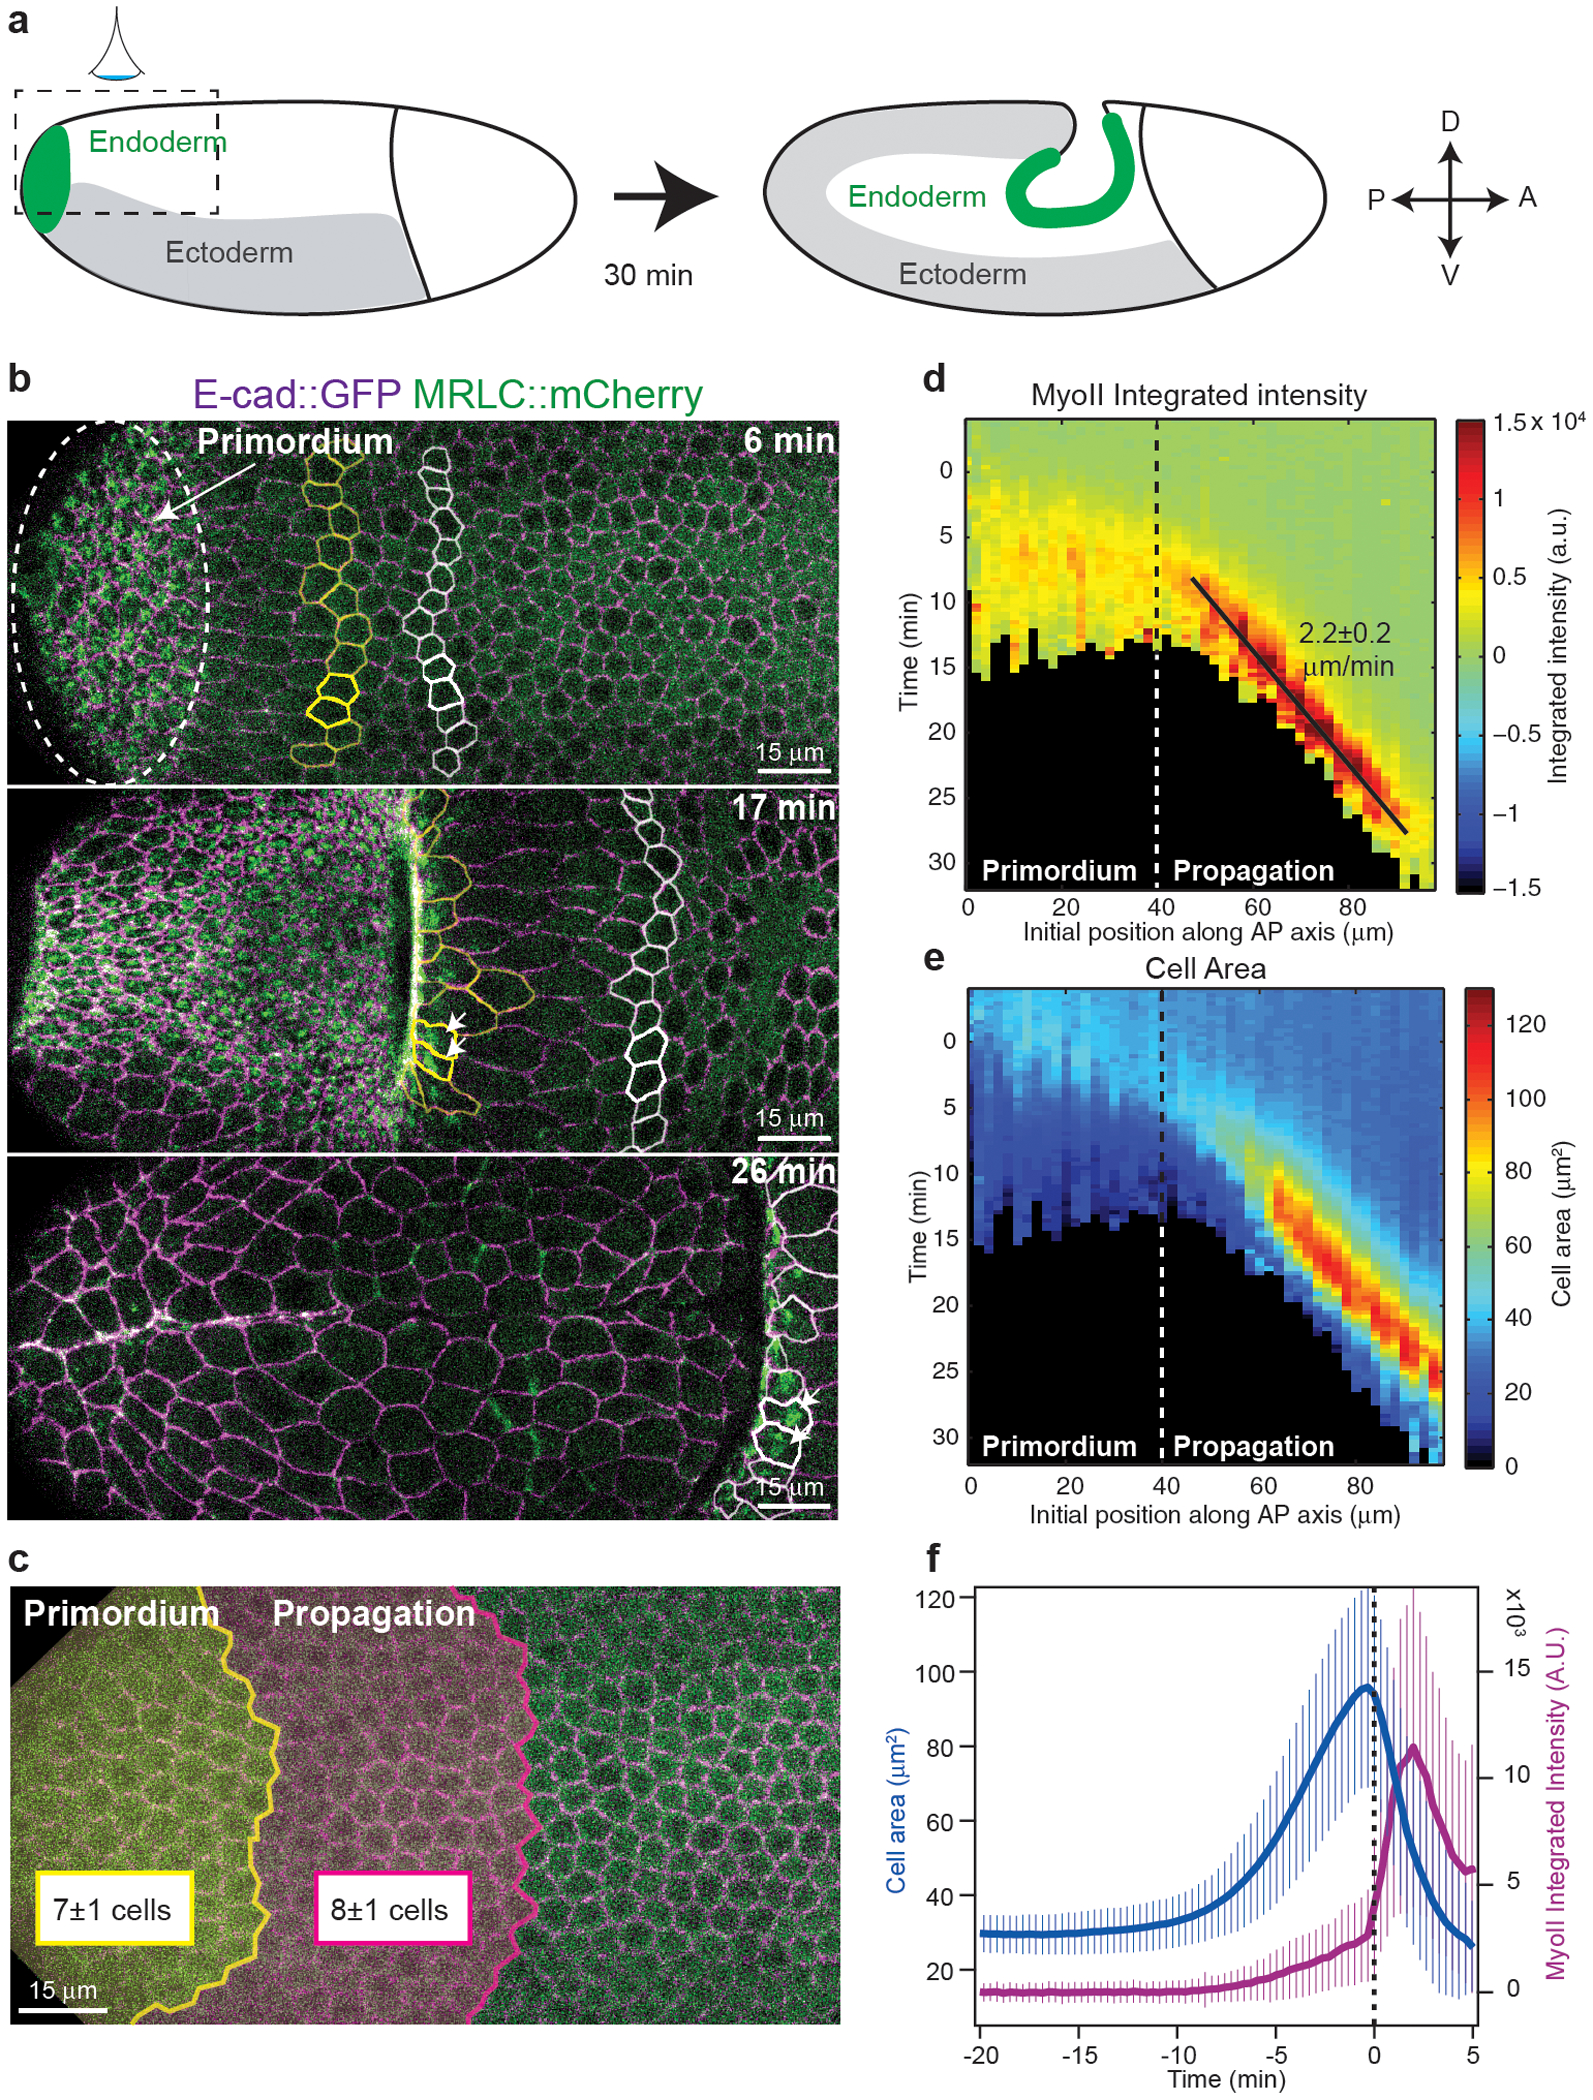
Figure 1. Propagation of MyoII activation in the posterior endoderm:

(a) Endoderm morphogenesis during embryonic axis extension. Dotted box: region of imaging. (b) Time-lapse of MyoII during endoderm morphogenesis. Dashed oval: the primordium region, in yellow and white cells of different medio-lateral rows, white arrows: MyoII activation. N=13 embryos. (c) Primordium and the propagation regions mapped on the dorsal epithelium at the onset of gastrulation. The size of each domain is indicated (N=13 embryos). (d-e) Kymograph heat-maps of median MyoII integrated intensity (d) and projected apical cell area (e). Dashed line: border between the primordium and propagation regions, black line: constant speed of the MyoII wave. N=947 cells, 5 embryos. (f) Time course of projected apical area and MyoII integrated intensity in cells in the propagation zone (N=456 cells, 6 embryos). Cells are registered on t0 the time of MyoII activation. Mean±SD in c,d,f.
