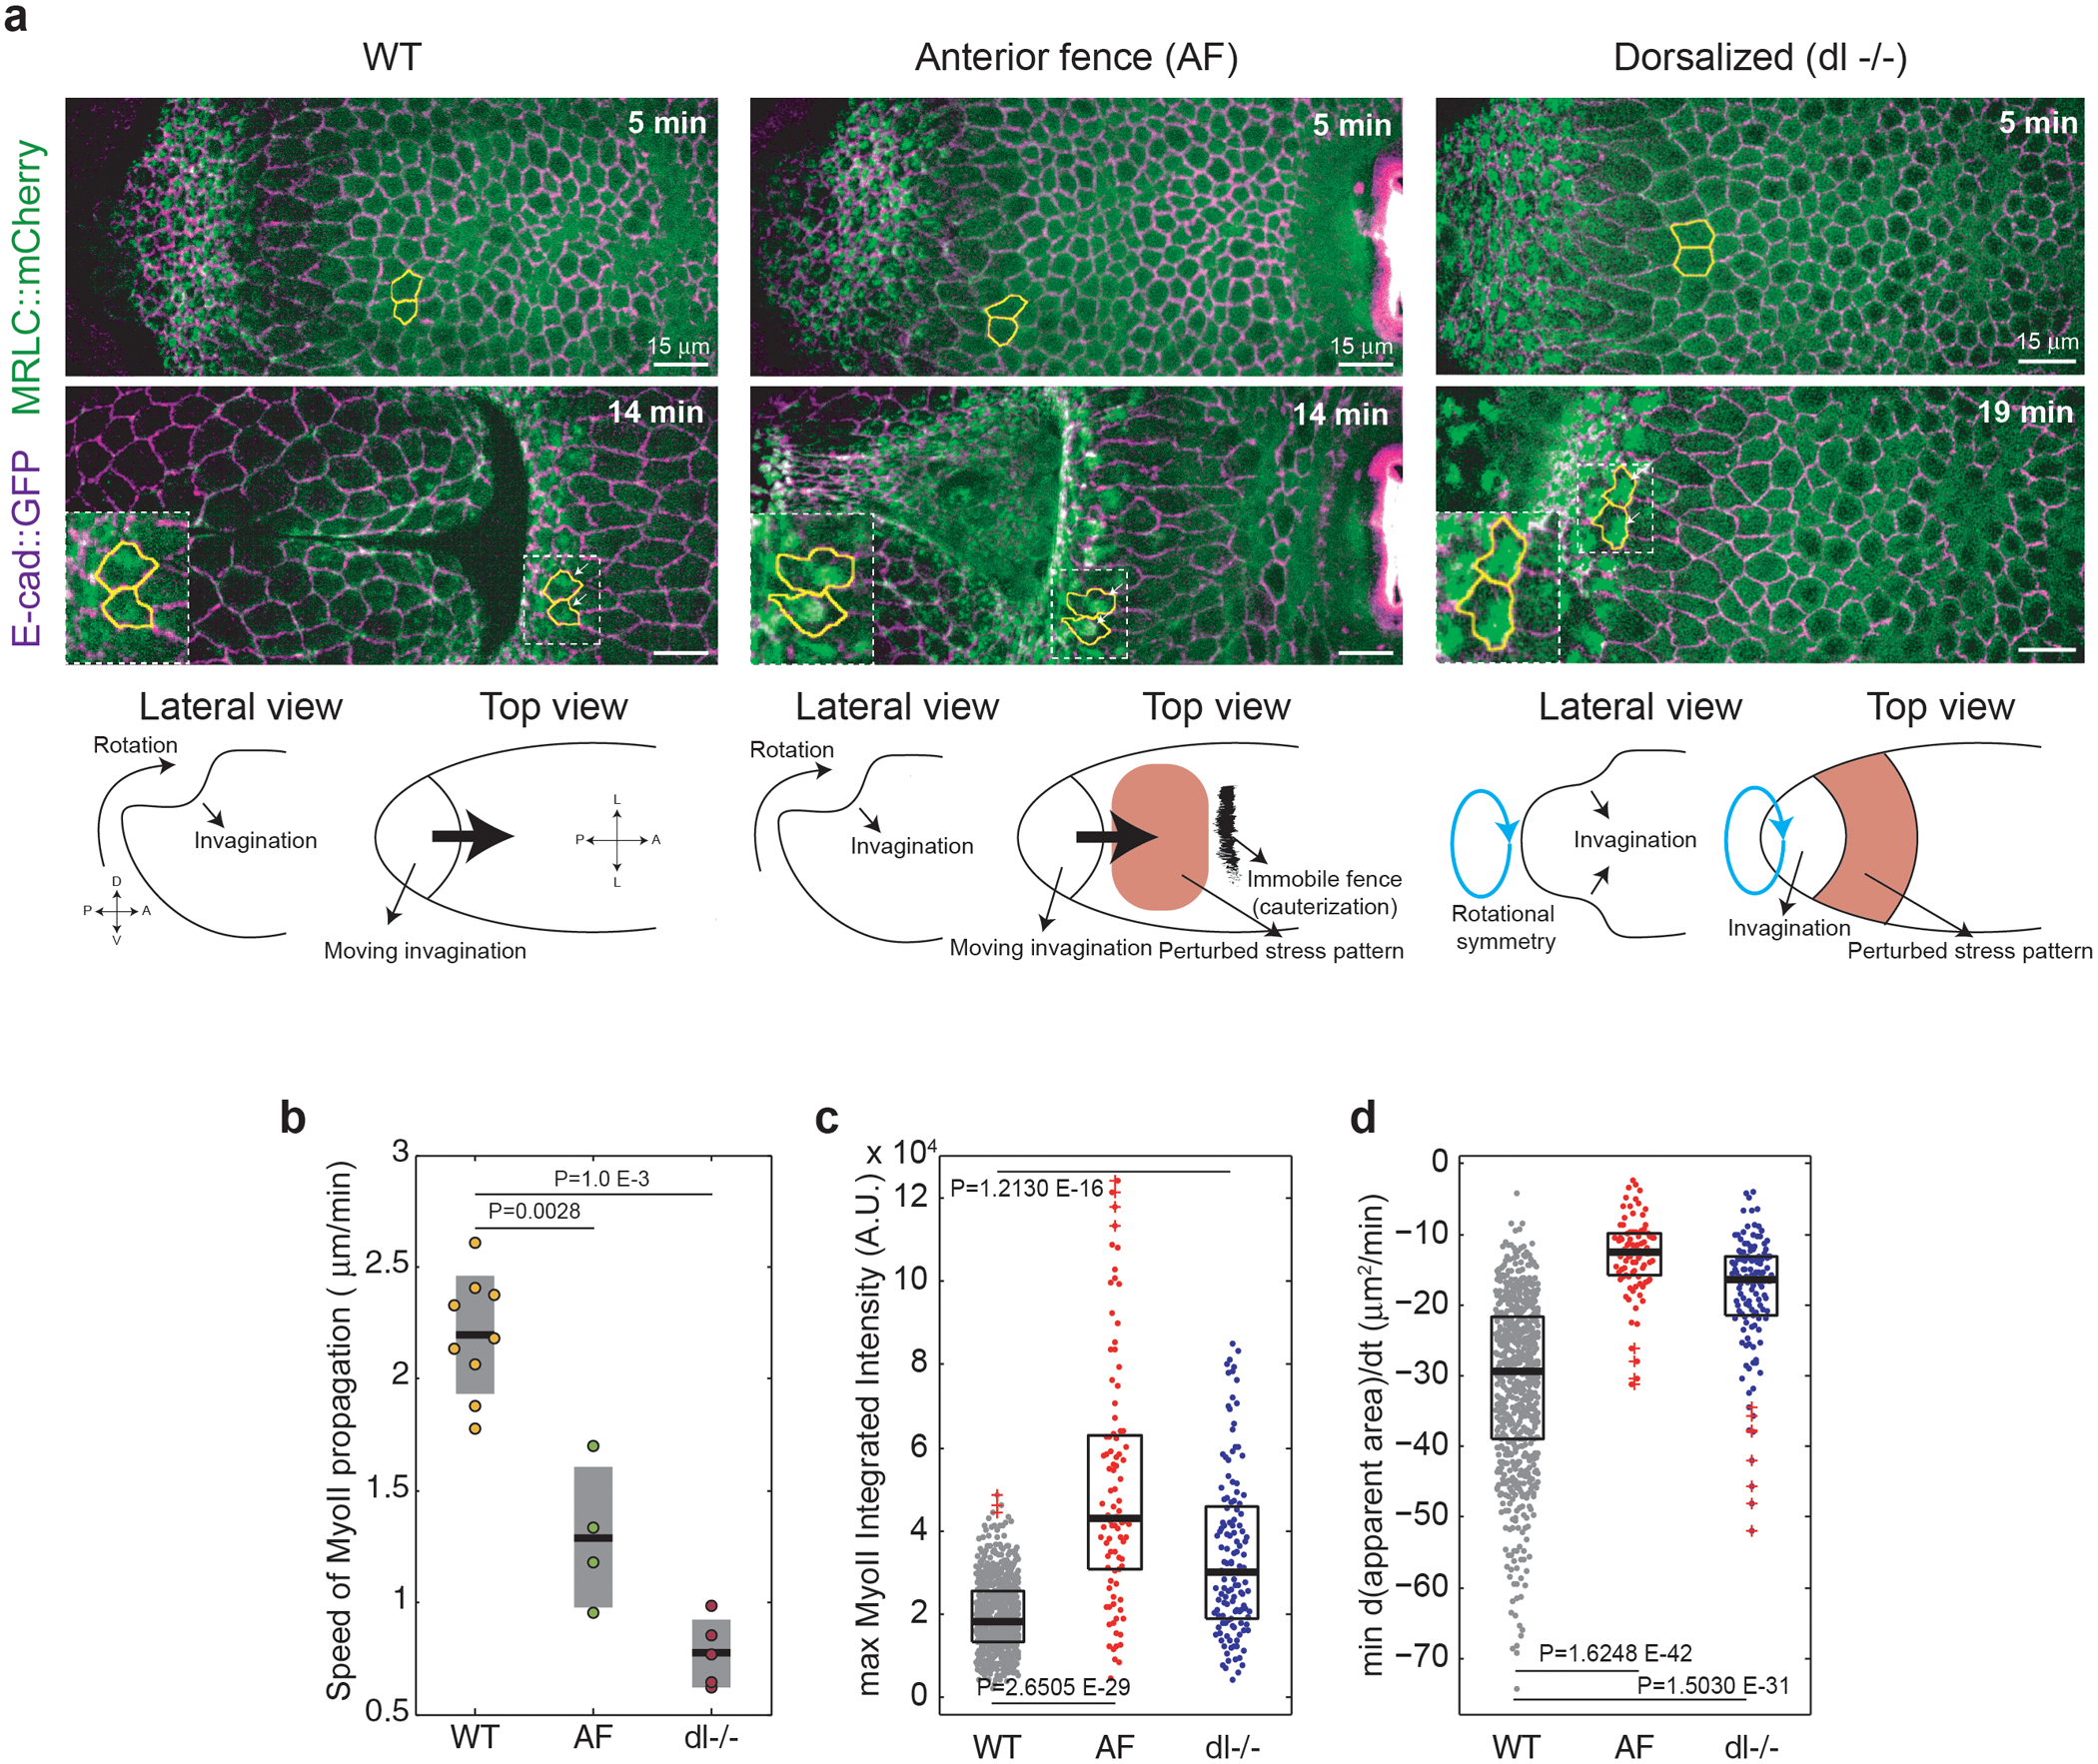
Extended Fig. 9. Mechanical perturbations affect propagation speed and MyoII recruitment:

(a) Time-lapse of a WT (left), an embryo with an anterior medio-lateral fence (AF, middle) and a dorsalized embryo (dl−/−, right). Marked in yellow are representative tracked cells in the propagation region. Bottom: Schematic representations of the normal and perturbed conditions. N=9 WT embryos, 4 AF embryos and 5 dl−/− embryos. (b) Speed of MyoII propagation in the reference frame of the tissue in the indicated conditions. N=9 WT embryos, 4 AF embryos and 5 dl−/− embryos. P=0.0028 and P=1.0E-3 from a two-sided Mann-Whitney test. (c-d) Maximum MyoII integrated intensity (c) and minimum rate of apical constriction (d) in cells of the propagation region for the indicated conditions. N=663 cells from 9 WT embryos, 93 cells from 4 AF embryos and 129 cells from 5 dl−/− embryos. P values are from a two-sided Mann-Whitney test. Boxplots show median and 25th and 75th percentiles. The red crosses label outliers.
