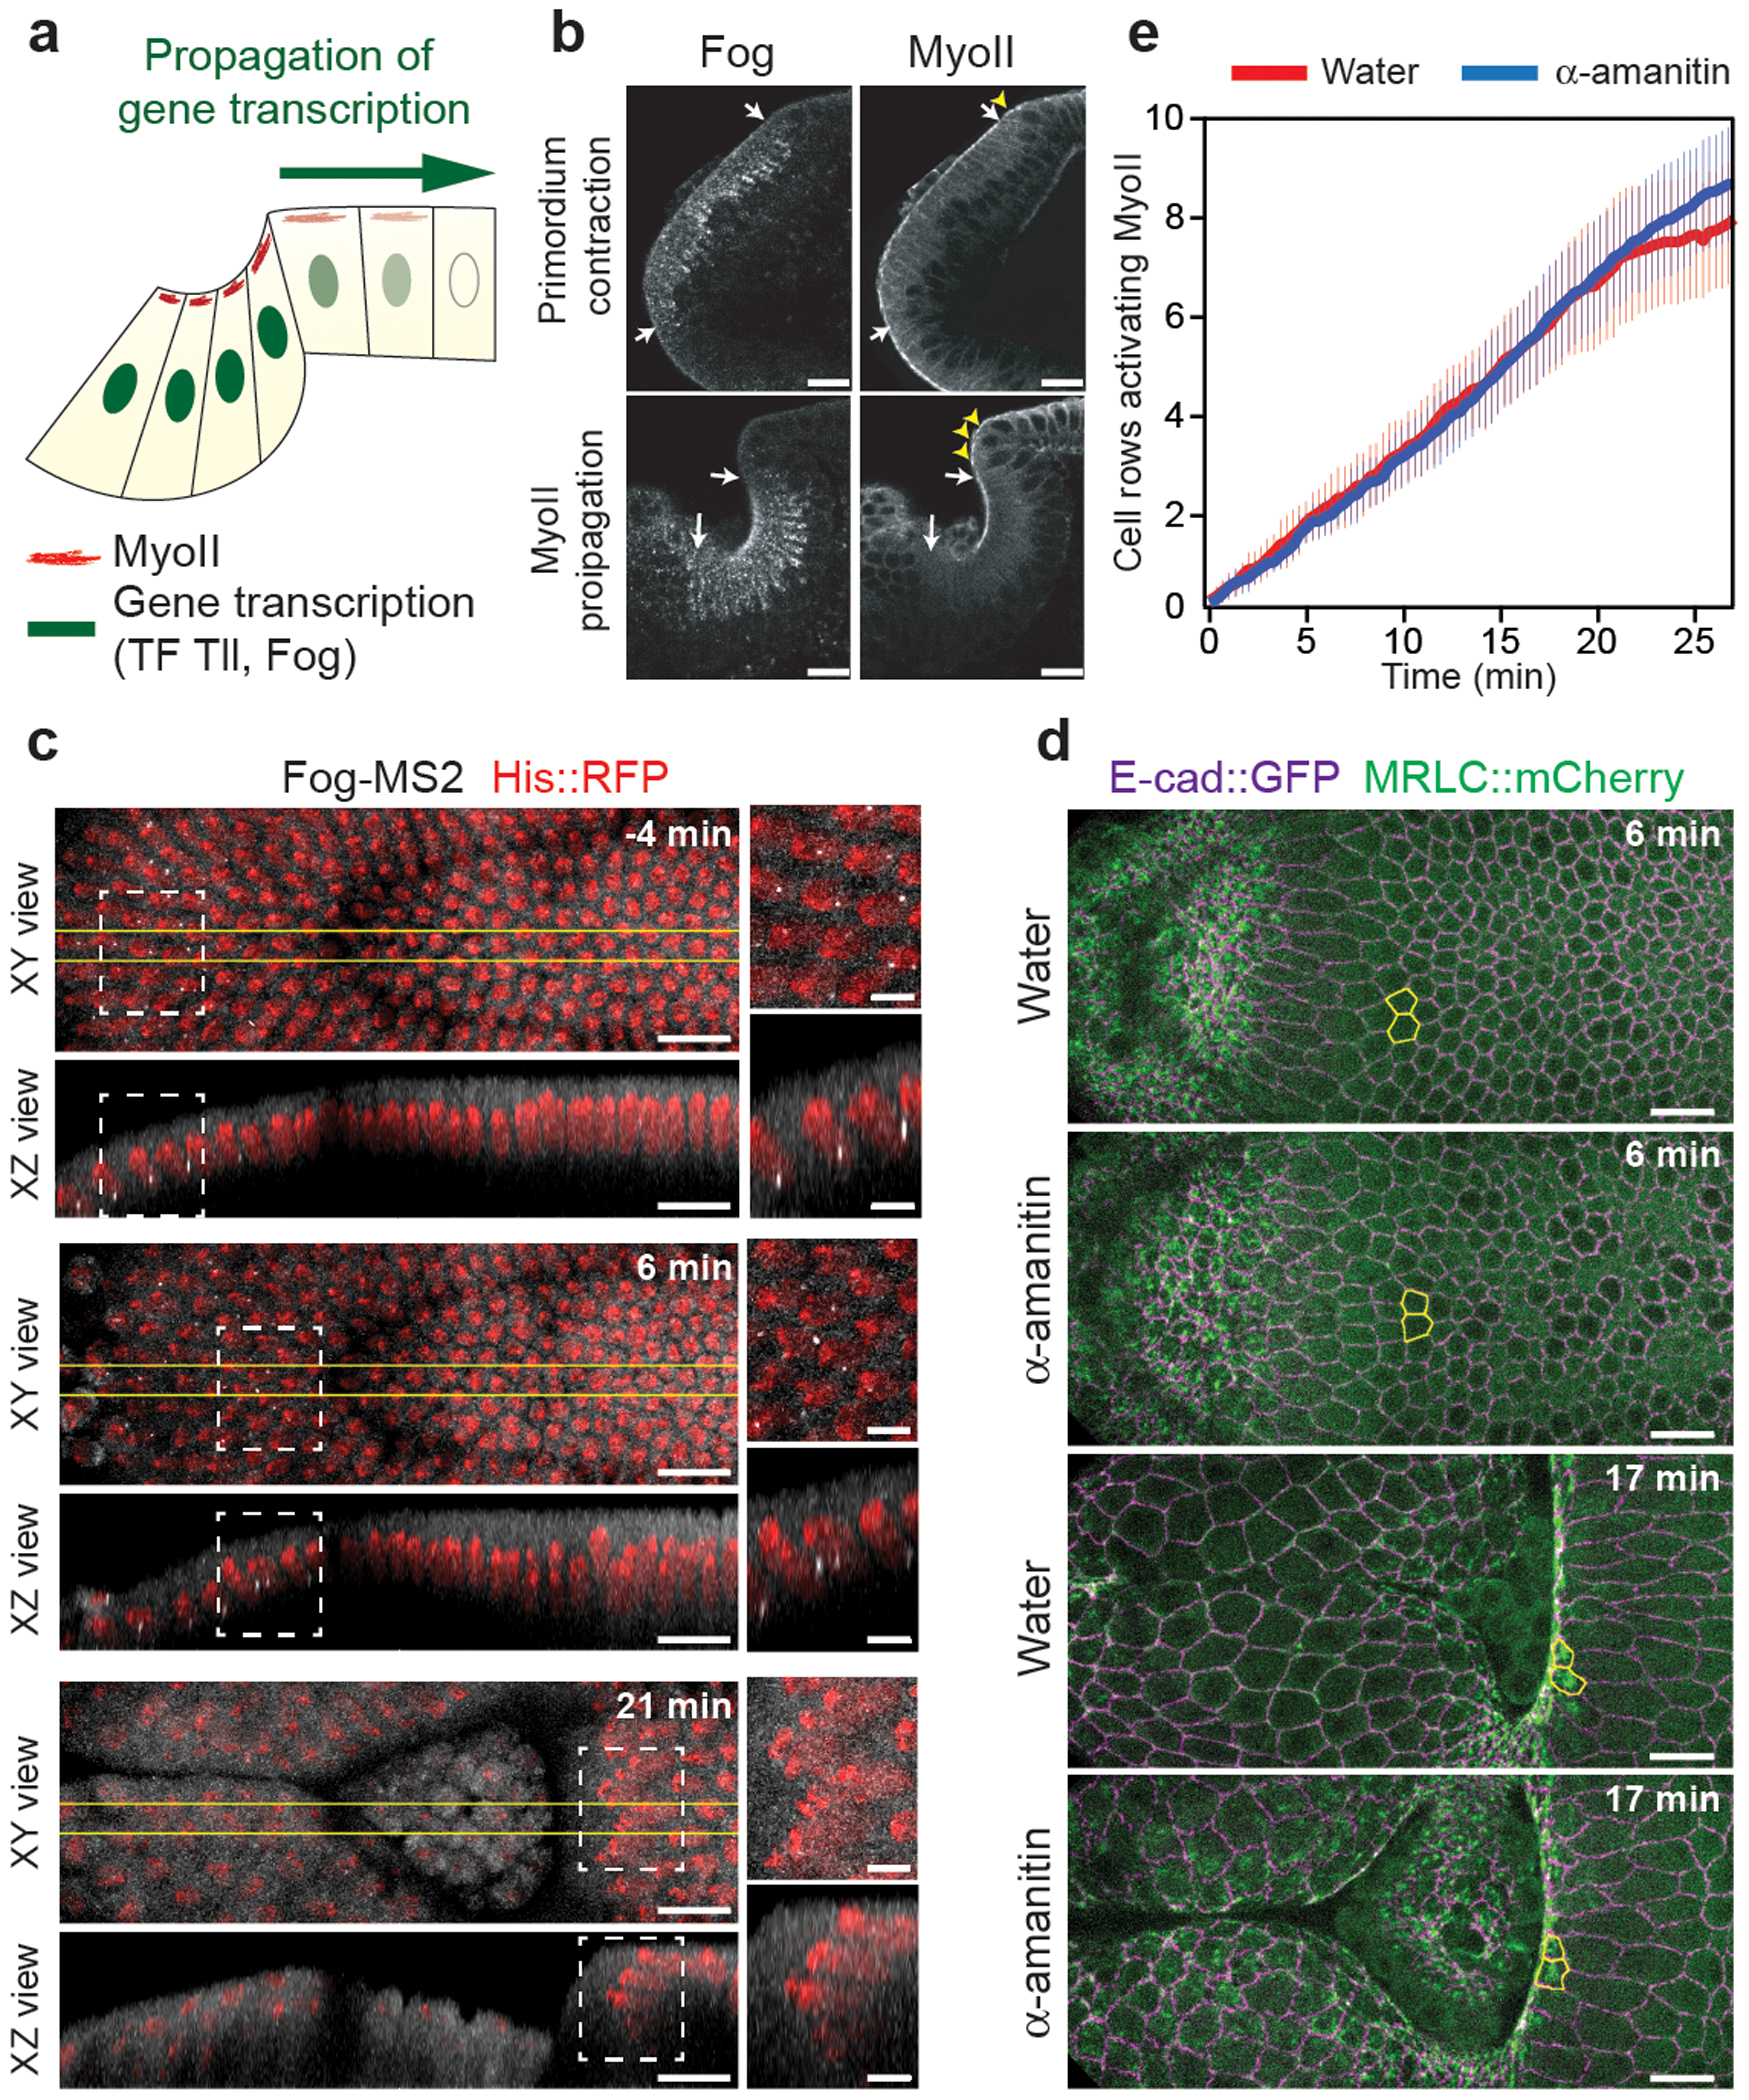
Figure 2. MyoII propagation does not depend on gene transcription:

(a) Illustration of the dorsal epithelium in a sagittal section describing the hypothesis of propagation in gene expression controlling MyoII propagation. (b) Sagittal sections of immunostainings for Fog and MyoII at the indicated stages. White arrows: boundaries of the fog expression domain, yellow arrowheads: cells recruiting MyoII at the anterior boundary of the furrow. N=7 embryos for primordium contraction and N=5 embryos for propagation stages from 2 independent experiments. (c) Time-lapse of fog expression in the posterior endoderm visualized with the MS2-MCP system35. White dashed boxes: positions of the close-ups, yellow lines: the region where side-views were generated. N=11 embryos. (d) MyoII wave propagation in control (water) and α-amanitin injected embryos. In yellow cells in the propagation region. (e) Quantifications MyoII propagation in water and α-amanitin injected embryos. The number of cell rows activating MyoII in the propagation region over time was measured. Mean±SD. In d and e N=11 for water and N=10 for α-amanitin injected embryos. In e t0 is the beginning of MyoII propagation. Scalebar 15μm in b,c,d and 5μm in the insets in c.
