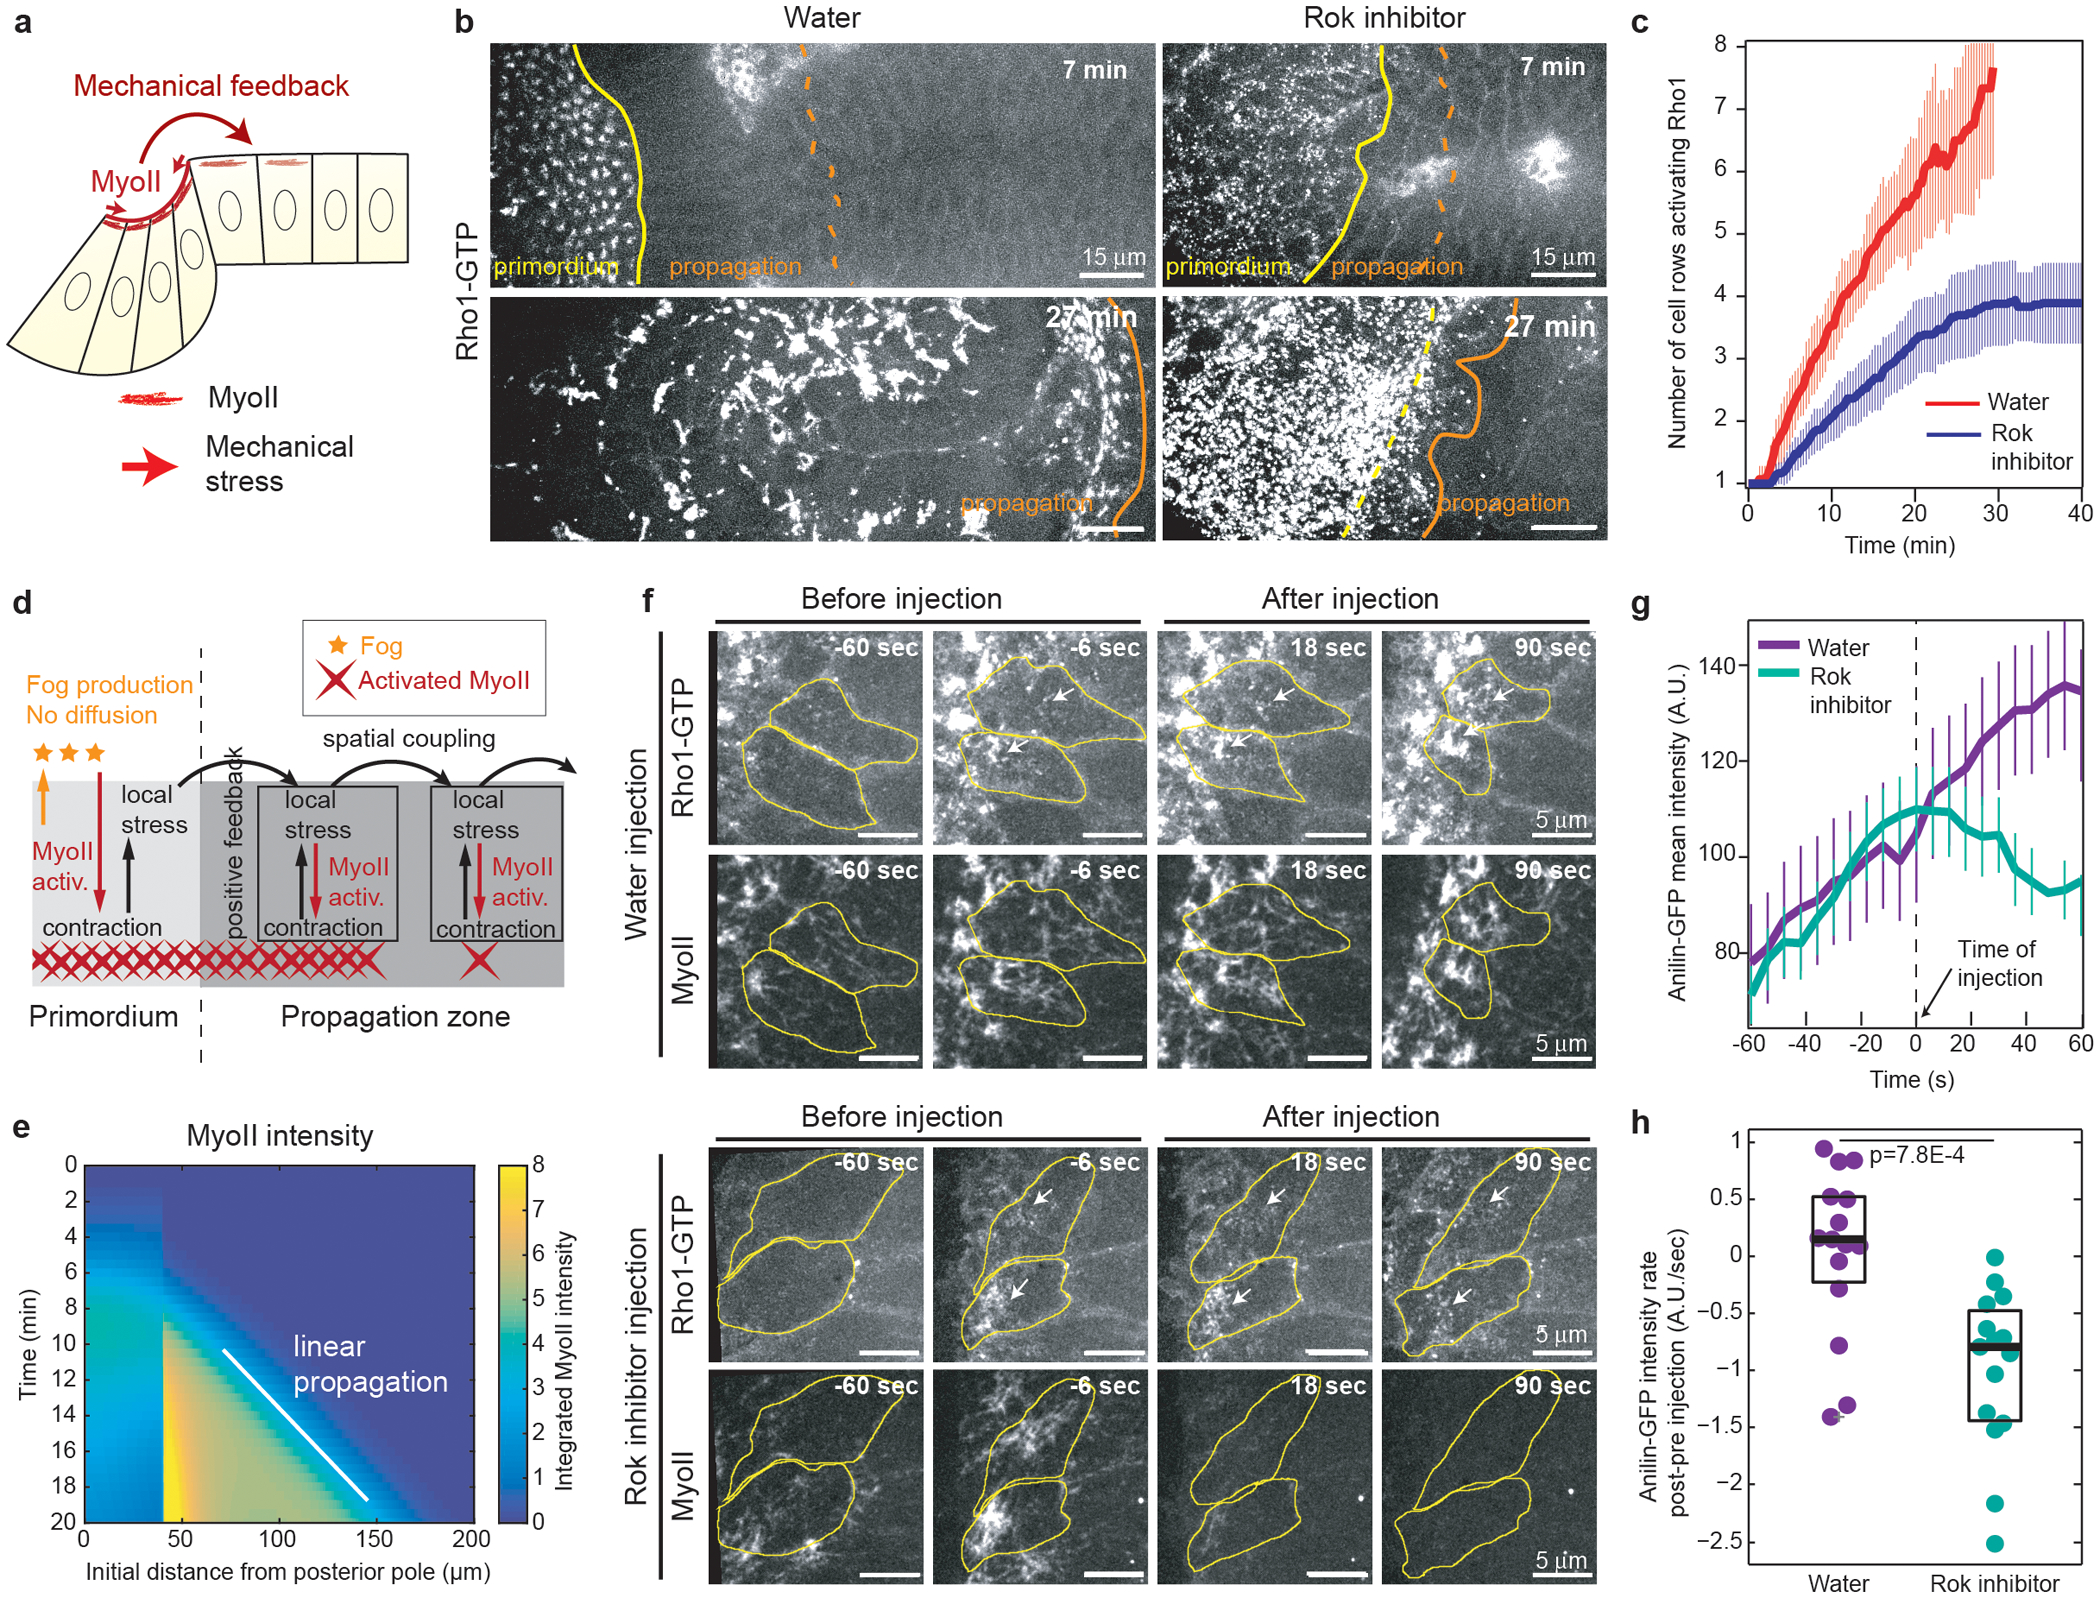
Figure 3. The MyoII wave is mechanically regulated and a feedback from MyoII promotes Rho1 activation in cells:

(a) Hypothesis of mechanical feedback controlling MyoII propagation. (b) Time-lapse of Rho1-GTP (Anillin(RBD)∷GFP) in water (N=10 embryos) and H-1152 (Rok inhibitor, N=12 embryos) injected embryos at end of cellularization. Yellow and orange lines highlight the primordium and propagation regions respectively. (c) Quantifications of the Rho1-GTP wave as in Fig.2e. Mean±SD. N=10 for water and N=12 for H-1152. (d) Model used to study the effects a stress-based feedback on MyoII (see Supplementary Information). Fog produced in the primordium activates MyoII but cannot diffuse. Instead, stress locally activates MyoII and propagates within the tissue. (e) Kymograph heat-map of activated MyoII (MyoII concentration integrated over the unit volume taking into account its local deformation, see Supplementary Information) from one simulation of the model in d. (f) Time lapse of Rho1-GTP (Anillin(RBD)∷GFP) and MyoII in water and H-1152 (Rok inhibitor) injected embryos during propagation. Yellow: cell contours, white arrows: accumulations of Rho1-GTP. N=15 cells, 3 embryos each. (g-h) Quantifications of the mean intensity of Rho1-GTP before and after injections. N=15 cells, 3 embryos each. (g) Mean intensity over time (Mean±SD). (h) Recruitment rate difference (post–pre injection) following Rok inhibitor injection. P=7.8E-4 from a two-sided Mann-Whitney test. Boxplots show the median, the 25th and the 75th percentiles. Grey crosses label outliers.
In c t0 is the beginning of MyoII propagation, in f and g time 0 is the time of injection.
