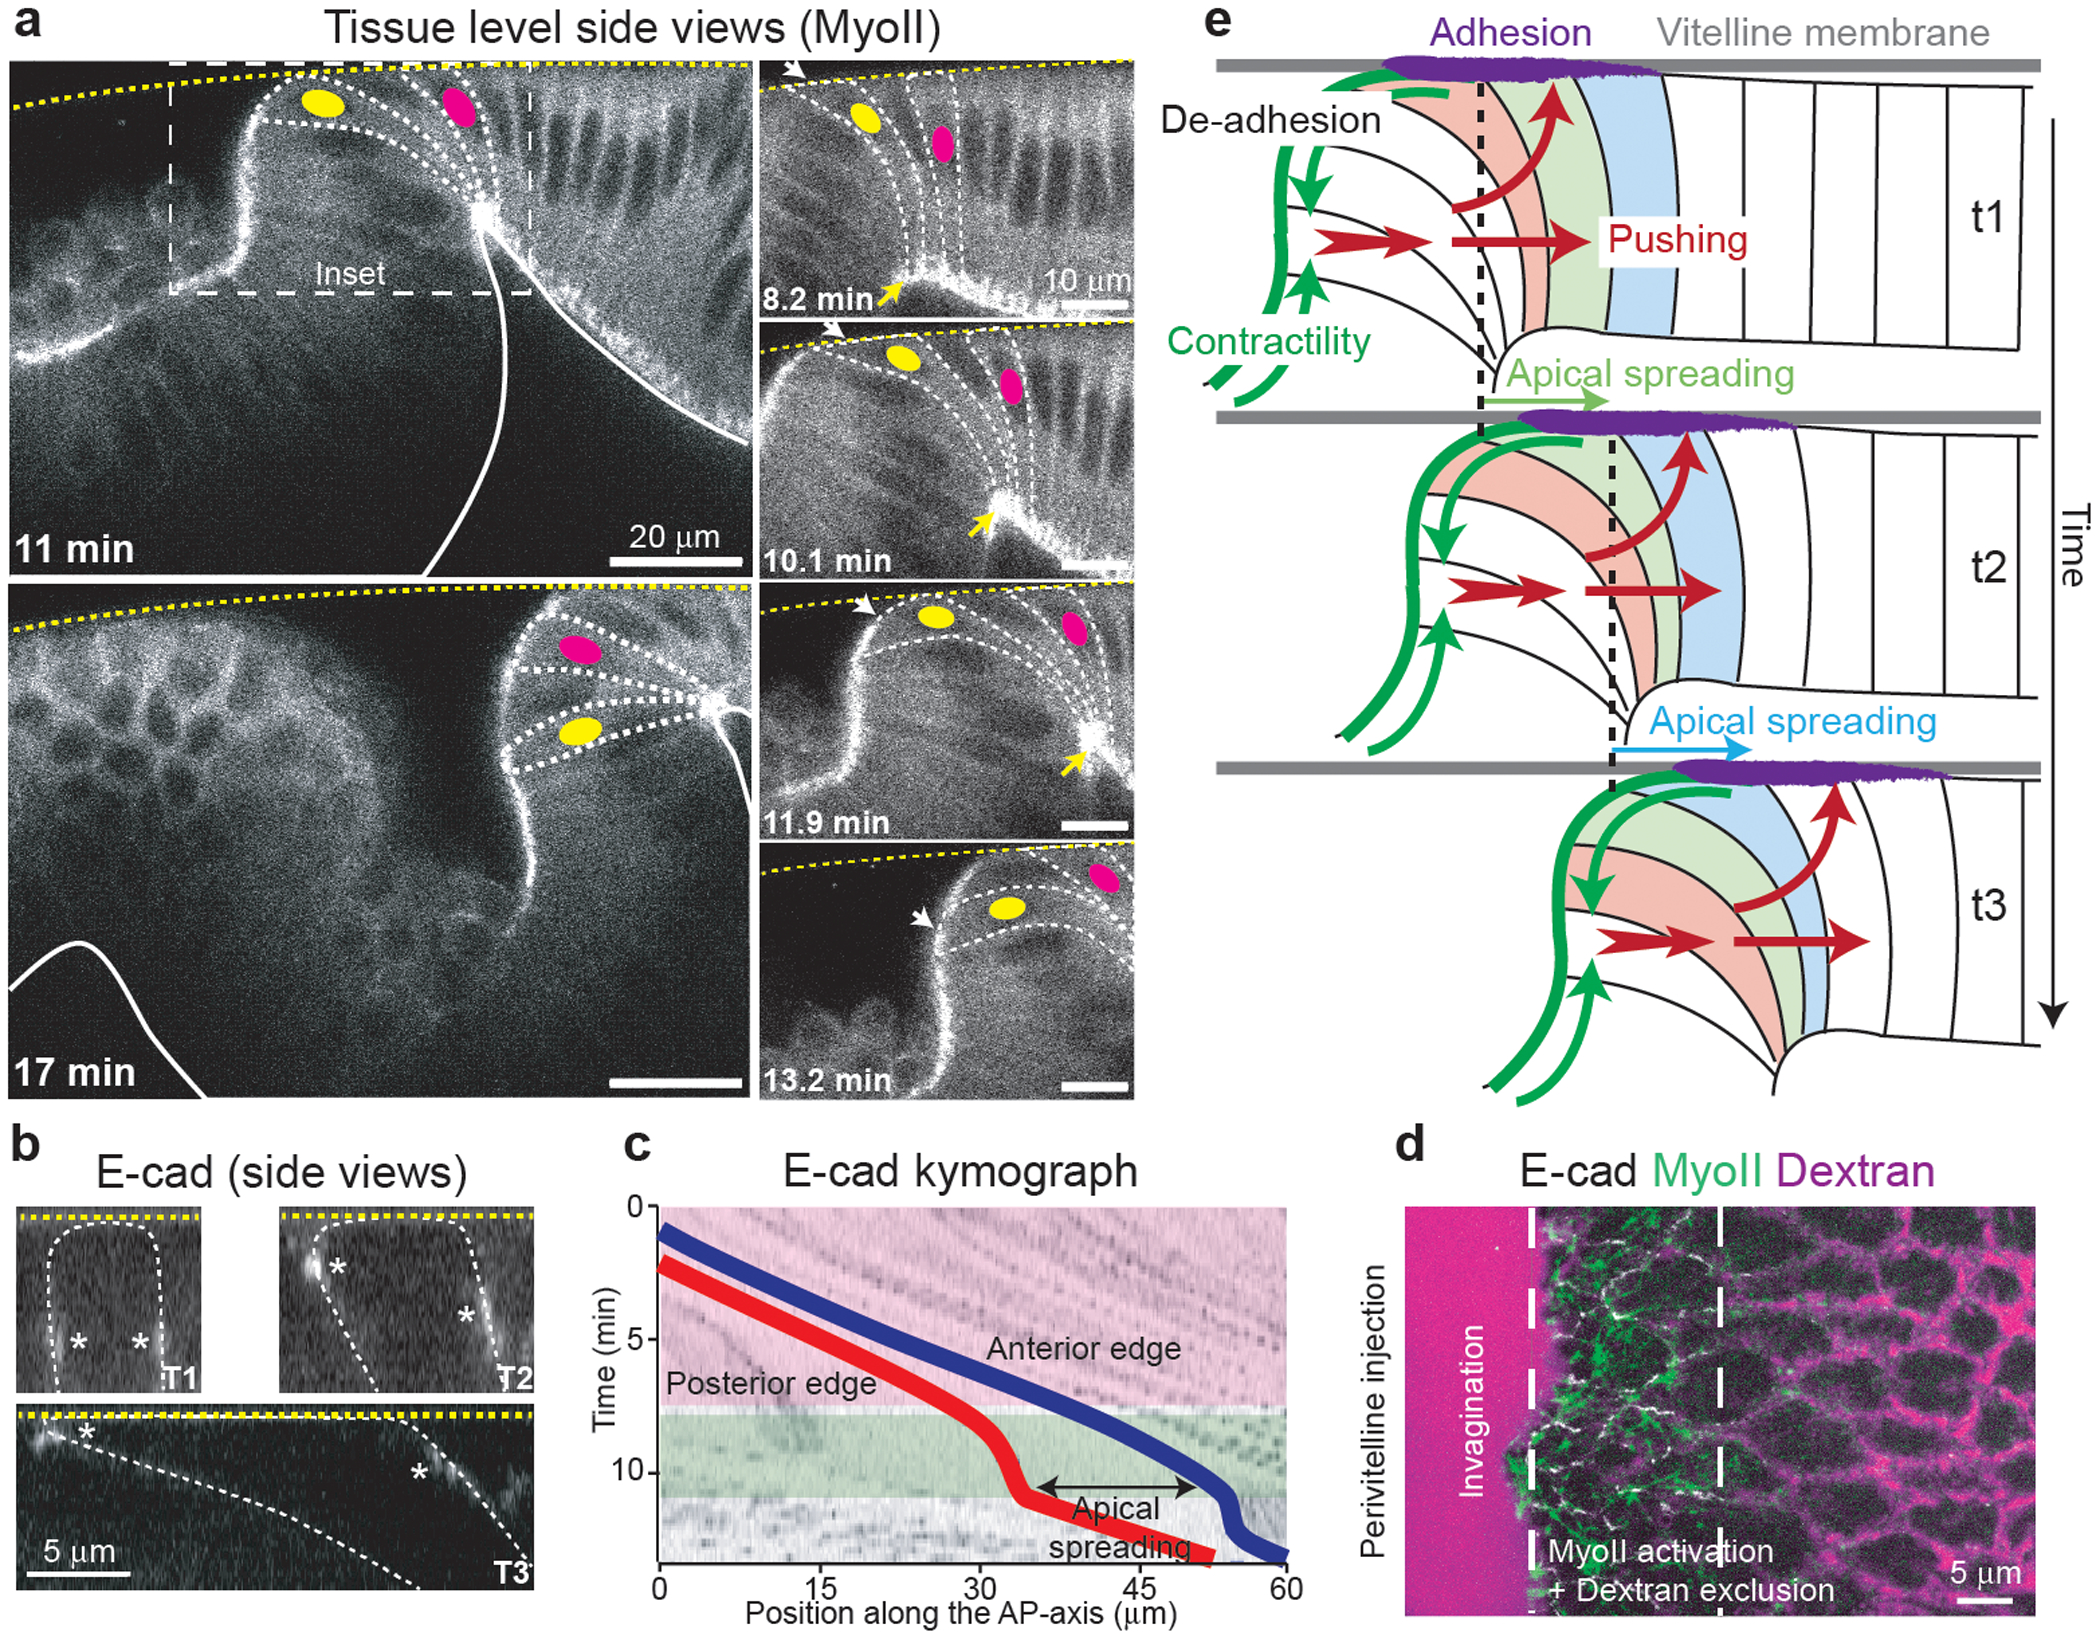
Figure 4. 3D cycle of cell deformations accompanying and sustaining MyoII activation:

(a) Side views of MyoII recruitment and cell deformations during wave propagation. Left: larger views. Right: closeup of the boxed region. Dashed white lines: cell contours, dashed yellow line: vitelline membrane, solid white line: basal side of the epithelium. The yellow and magenta dots label 2 cells. White and yellow arrows: the apical and basal side of cells respectively. N=2 embryos. (b) Side views of E-cad during apical spreading of a cell in the propagation zone. Dashed yellow line: vitelline membrane. Dashed white line: cell outline. White asterisks: E-cad junctions. N=50 cells, 3 embryos. (c) Kymograph illustrating the movement and deformation along the AP-axis of a cell in the propagation zone. Red and blue traces: posterior and anterior edges of the cell respectively. Pink and green boxes: phases of rapid cell displacement and immobilization of the posterior edge respectively. N=456 cells, 6 embryos. (d) Dextran injection in the perivitelline space during MyoII propagation. Dashed white lines: region of MyoII activation and dextran exclusion. N=3 embryos. (e) 3D mechanical cycle associated to the MyoII wave. Green arrows: MyoII contractility, purple zone: zone of apical adhesion, red arrows: pushing forces. Three cells undergoing the cycle at consecutive time points are labelled in different colors.
In d t0 is arbitrary.
