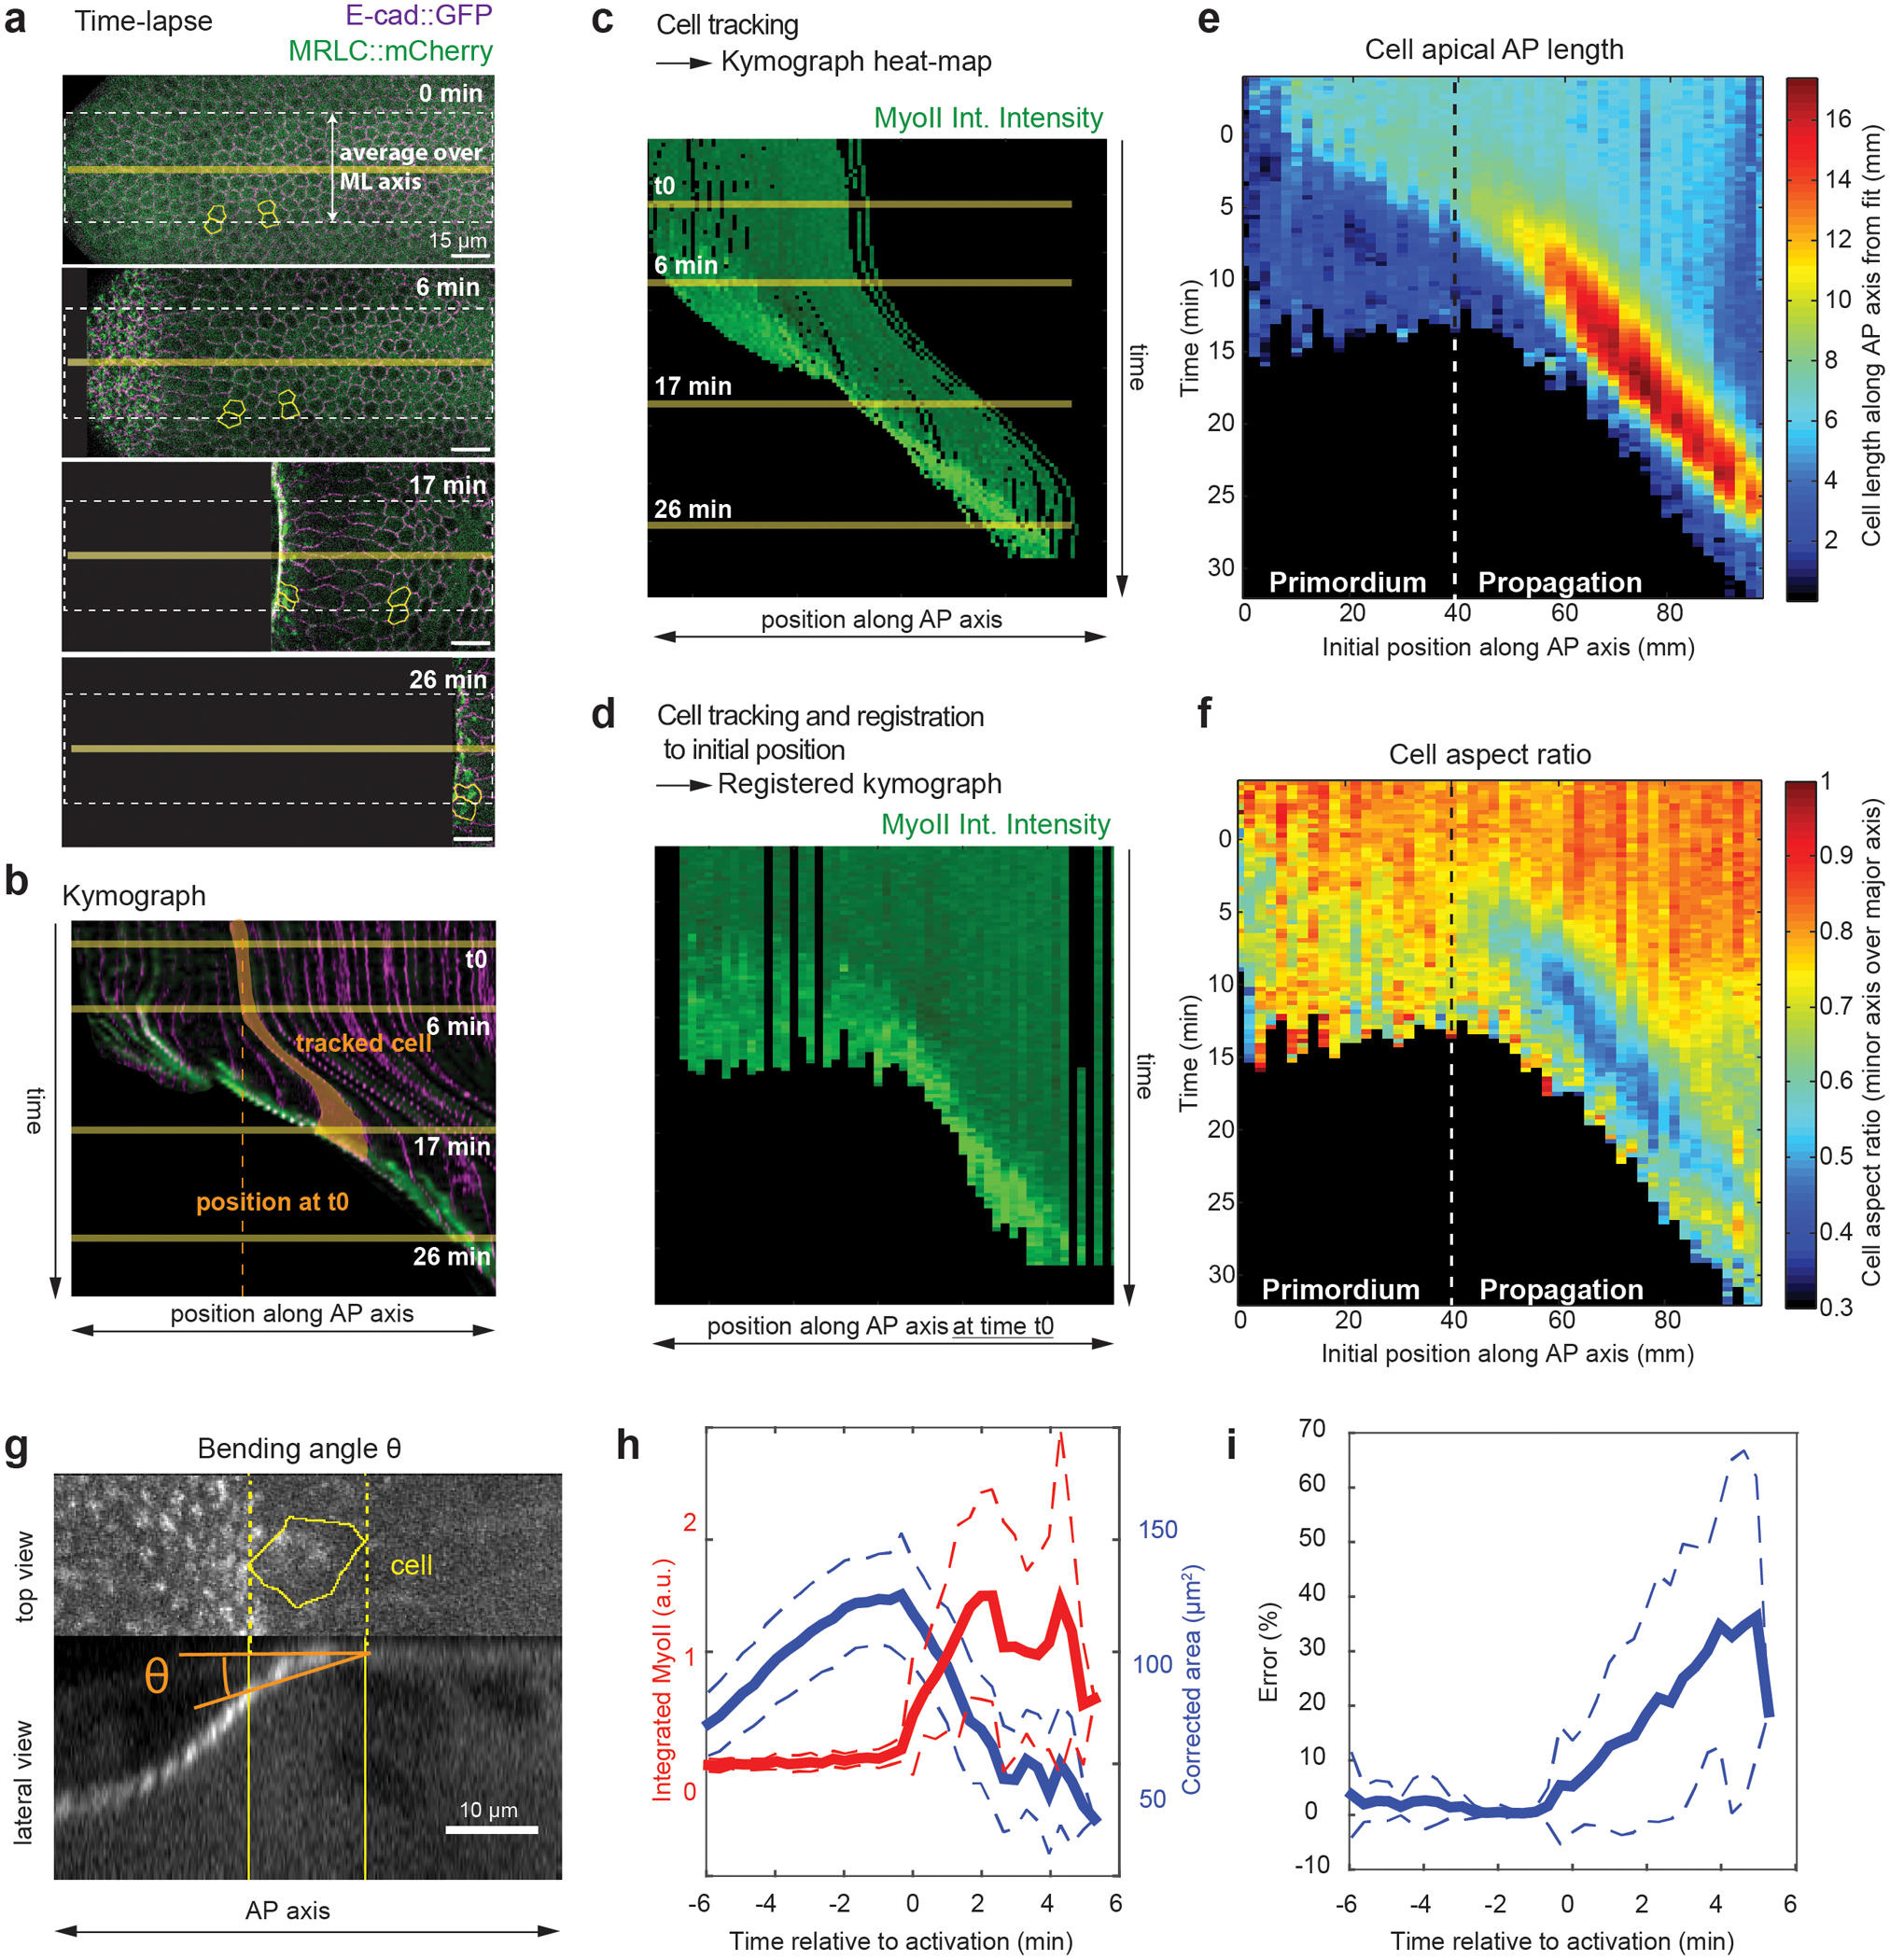
Extended Figure 1. Quantification of the morphogenetic wave within the dorsal posterior epithelium:

(a-d) Procedure to generate kymograph heat-maps from time-lapses of endoderm morphogenesis. In a stills of a dual color time-lapse, E-cad∷GFP is in magenta and MyoII is in green. (b) A kymograph generated along the yellow horizontal line in a. A single cell, highlighted in yellow, first moves towards the anterior and then increases its projected apical area before recruiting MyoII. Solid yellow lines: time of the stills in a, dashed vertical line: the position of the cell at time t0. (c) Kymograph heat-map of MyoII integrated intensity measured using cell tracking in a. Data are averaged along the ML axis within the white dashed line box in a and cell positions are the positions at time t. Note that cell tracks display movements similar to the kymograph in b. (d) Kymograph heat-map of MyoII integrated intensity registered on the cell positions at time t0 extracted from cell tracking in a. Data are averaged along the ML axis, as in c, but now each cell track is plotted according to its position along the AP axis at time t0. Cell tracks do not display any movement and appear as straight vertical lines. As a result tissue deformation is not considered and the movement of the wave across the tissue can be visualized. Time t0 is the onset of endoderm morphogenesis. (a-d) N=1 embryo for demonstration purposes. (e-f) Kymograph heat-maps of AP apical cell projected length (e) and cell aspect ratio (f). The primordium and propagation regions are indicated. N=947 cells from 5 embryos. (g) Representation of the bending angle θ in a lateral view from a tracked cell (yellow contour) (see Methods). (h) Average time traces of the corrected area (see Methods) and MyoII integrated intensity. Cells are registered on t0 the time of MyoII activation. The corrected area decreases when MyoII intensity increases indicating that cells are truly constricting. (i) Time trace of the relative error in the measurement of cell area (i.e. underestimation of the real cell area) due to the bending angle. (g-i) N=24 cells, 1 embryo, with θ measured automatically (Method 1, see Methods) on MyoII side views. Mean±SD are shown.
