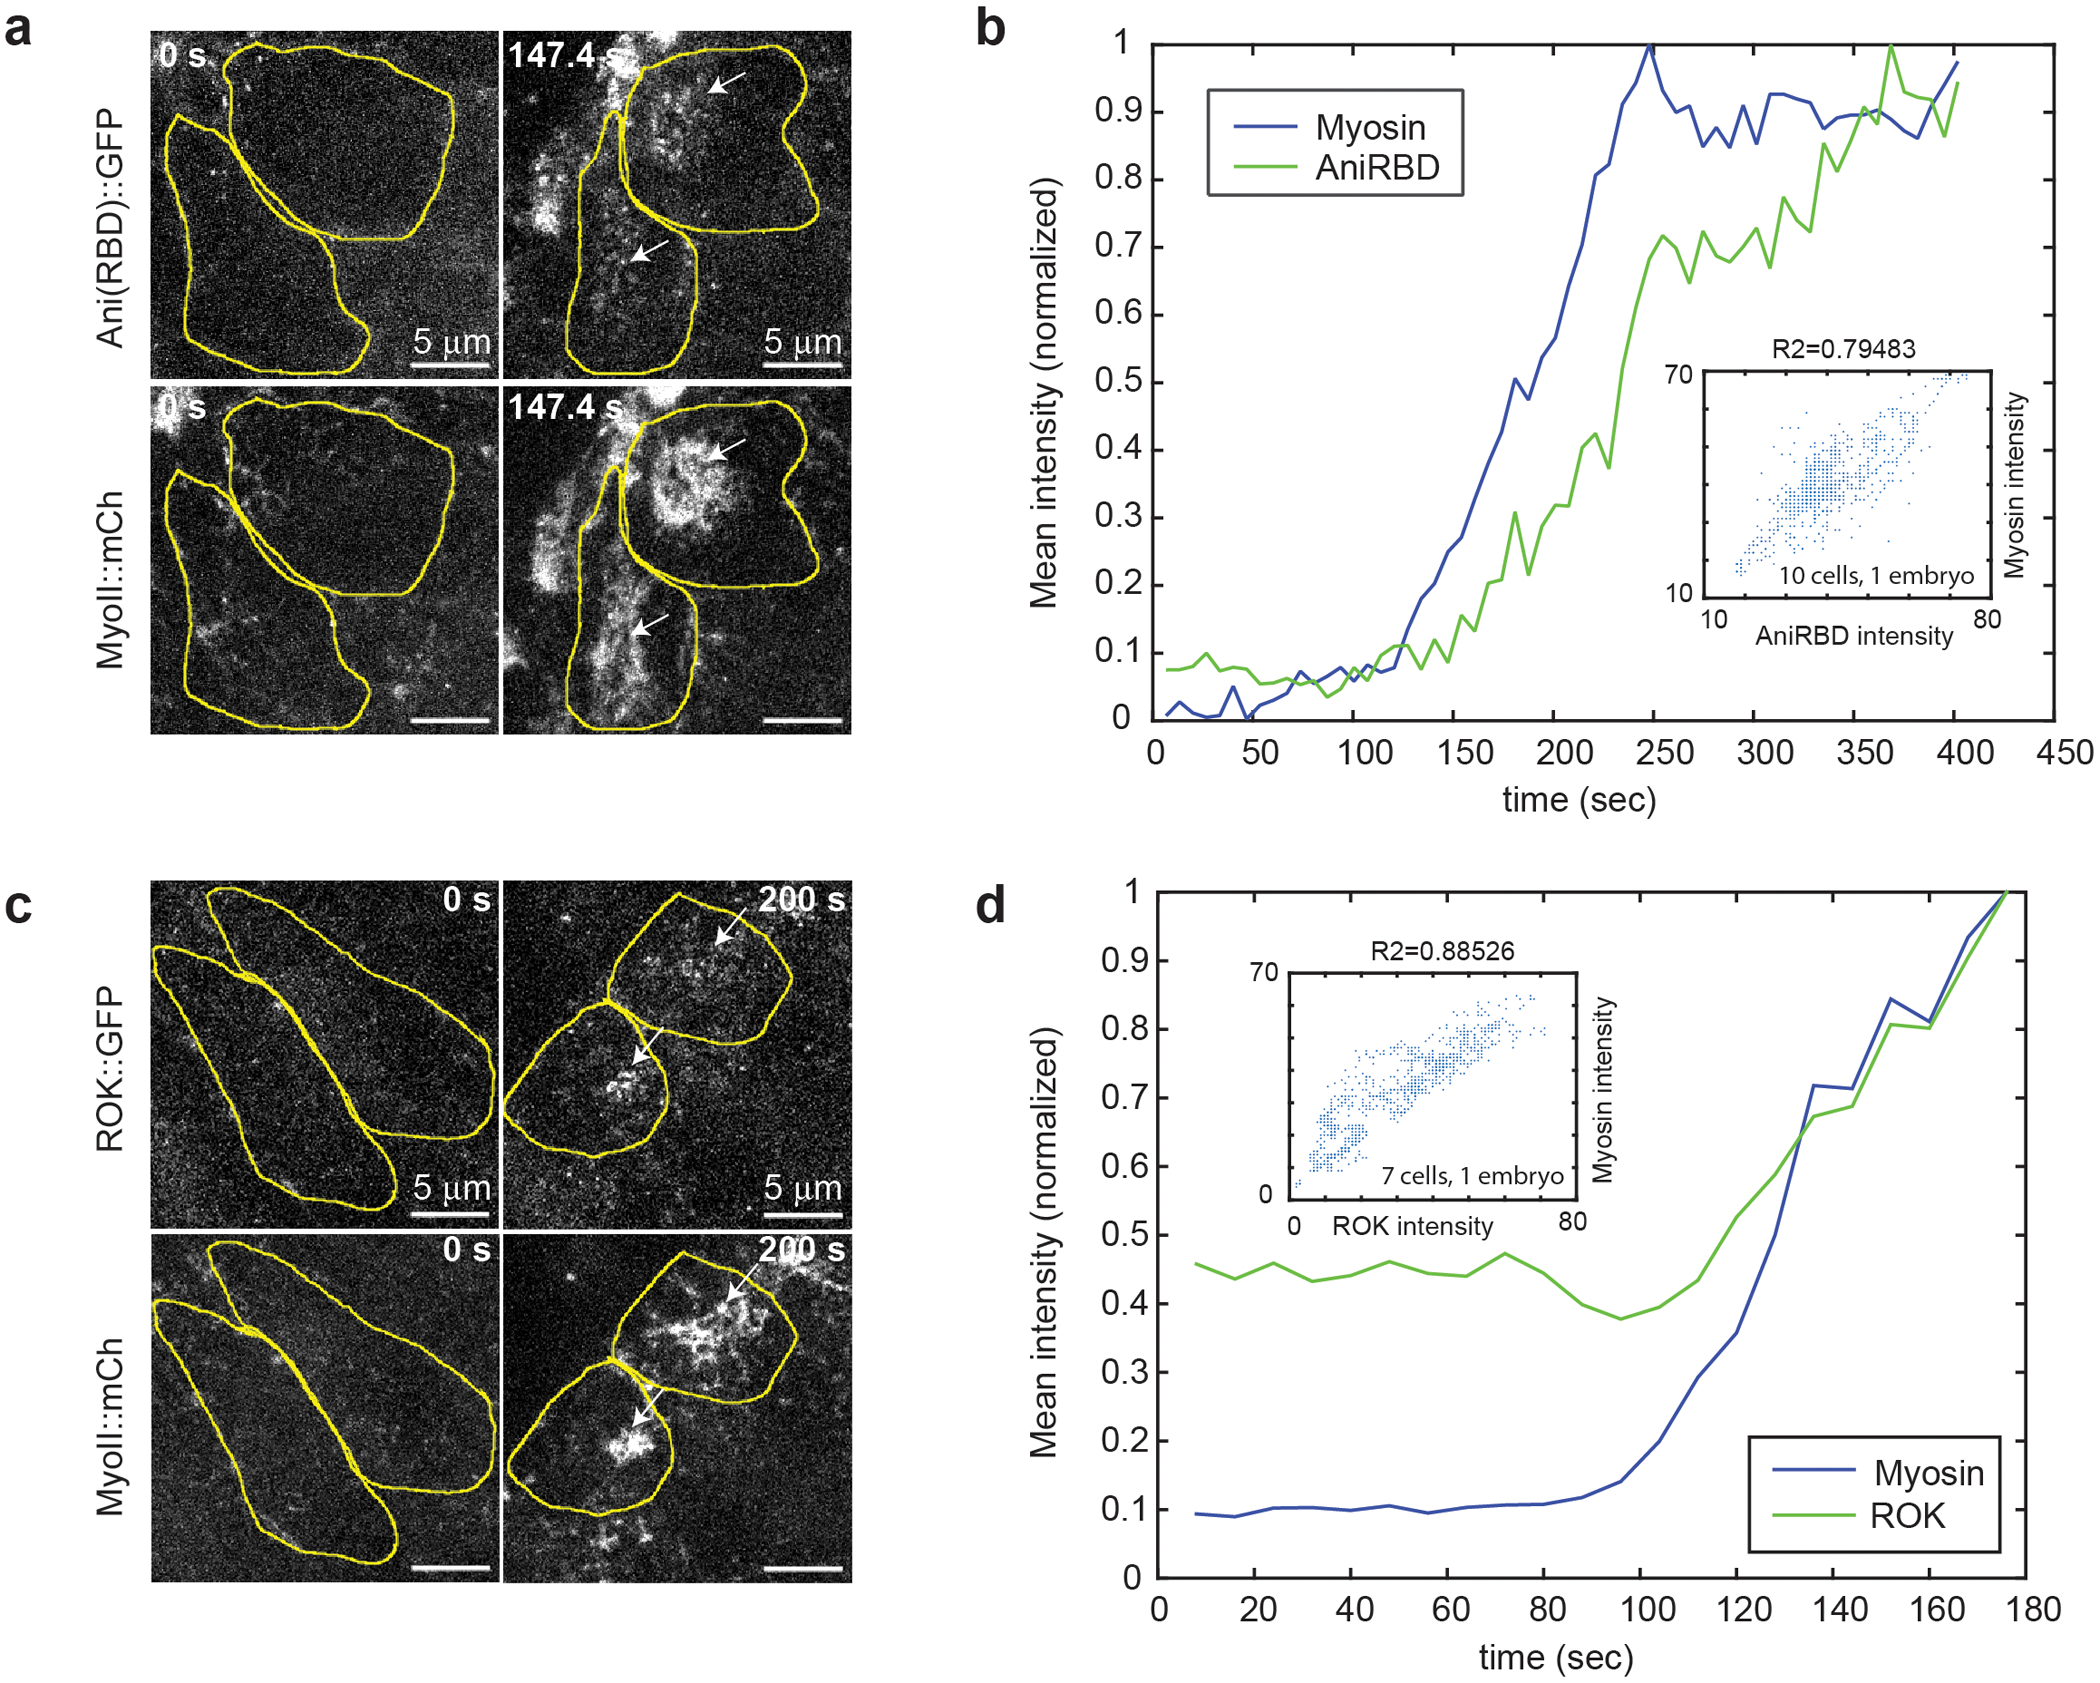
Extended Figure 3. Rho-GTP and Rok propagate together with MyoII during the wave:

(a and c) High resolution stills of cells in the propagation region labeled with MyoII and with the Rho1-GTP sensor, Anillin(RBD)∷GFP (N=4 embryos) (a), and RokKD∷GFP (N=4 embryos) (c). Cell contours are in yellow. (b and d) Curves of Rho1 sensor (b) and Rok (d) mean intensity over time along with MyoII in one representative cell of the propagation region. Intensity values are normalized to the max of each curve for visualization purposes. In the insets, scatter plots of MyoII mean intensity vs Rho1 sensor mean intensity (b) or Rok mean intensity (d) from ~10 cells in the embryo shown in (a) and ~7 cells in the embryo shown in (c) (see Methods). In the insets in b and d R2 is the square of the Pearson correlation coefficient. In a-d t0 is artbitrary.
