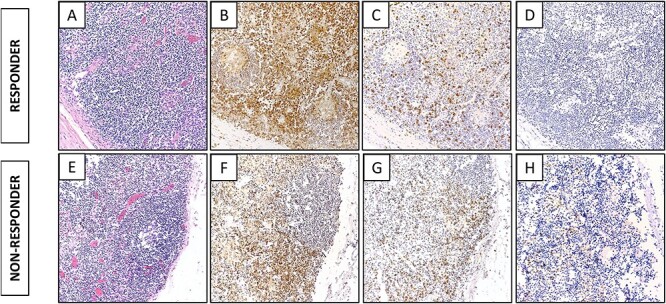
Figure 1 .

Representative immunohistochemistry images of marker expression in regional lymph nodes of a responder and a non-responder to immunotherapy. In a responder: (A) H&E; (B) CD4; (C) CD8; (D) TIA expression. In a non-responder: (E) H&E; (F) CD4; (G) CD8; (H) TIA expression.
