
Figure 2.
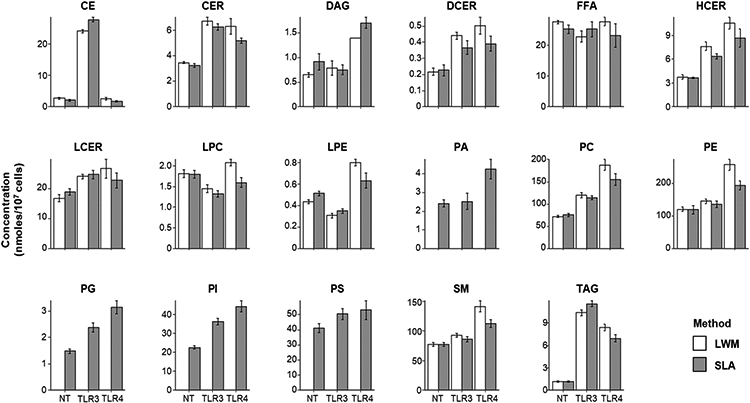
Independent experiments performed in LWM and SLA yield comparable quantitative results. Lipid subclass total concentration reported in nanomoles/107 cells. Totals calculated by summing the concentration of all species measured within subclass. Error bars represent standard deviation (n=4).