Figure 1.
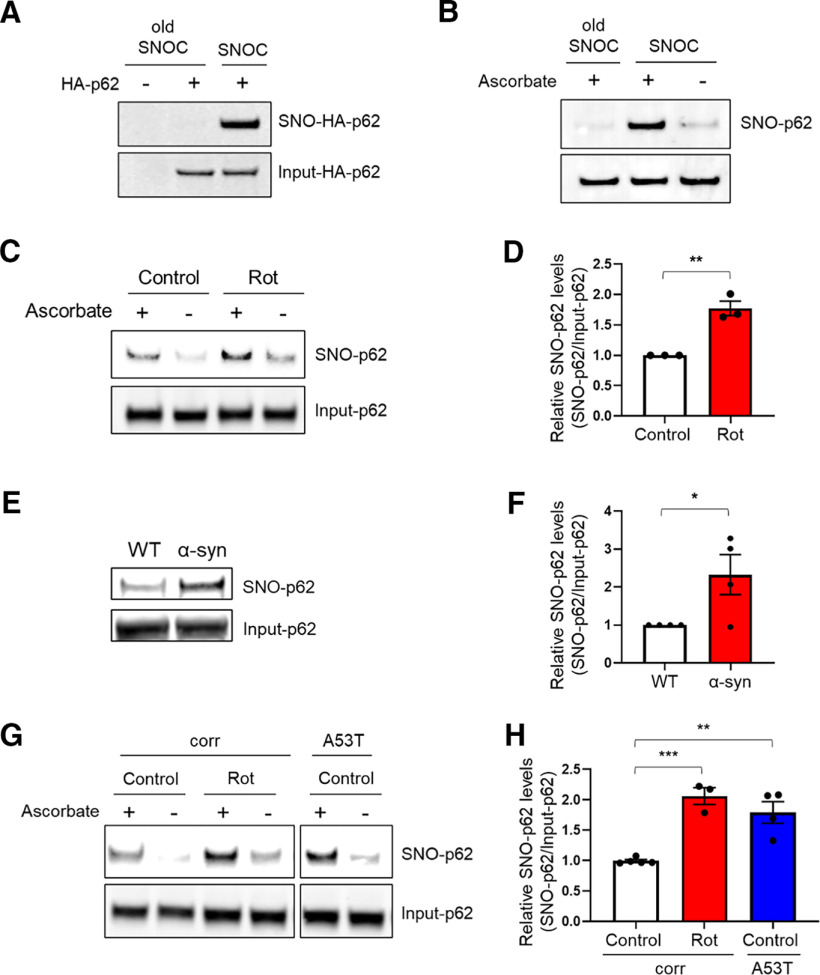
S-Nitrosylation of p62 in PD/LBD models. A, B, S-Nitrosylation of exogenous and endogenous p62 by the NO donor SNOC. HA-p62 transfected SH-SY5Y cells (A) or untransfected SH-SY5Y cells (B) were exposed to 100 μm freshly prepared SNOC or old SNOC (from which NO had been dissipated). After 20 min, cell lysates were subjected to the biotin-switch assay. The “ascorbate minus” sample served as a negative control. SNO-p62 and total (input)-p62 detected by immunoblot with anti-p62 antibody. C, S-Nitrosylation of p62 by endogenously generated NO. SH-SY5Y cells exposed to 1 μm rotenone (Rot) in the presence of 1 mm l-arginine and subjected to biotin-switch assay. D, Ratio of SNO-p62/input p62 (lanes 1 and 3). Data are mean ± SEM; n = 3. **p < 0.01, Student's t test. E, S-Nitrosylation of p62 in transgenic PD/LBD mouse model. Brain lysates from 4-month-old control (WT) or human Thy1 promoter-driven α-syn-overexpressing mice subjected to biotin-switch assay. F, Ratio of SNO-p62/input p62 from WT or α-syn-overexpressing mice. Data are mean ± SEM; n = 4 mice in each group. *p < 0.05, Student's t test. G, S-Nitrosylation of p62 in hiPSC-DA neurons. A53T mutant α-syn or isogenic control (corr) hiPSC-DA neurons in the presence or absence of 1 μm rotenone were subjected to the biotin-switch assay. The corr and A53T blots are derived from the same gel. H, Ratio of SNO-p62/input p62 (lanes 1, 3, and 5). For each histogram, data are mean ± SEM; n = 3. **p < 0.01, ***p < 0.001, ANOVA with Tukey's correction.

