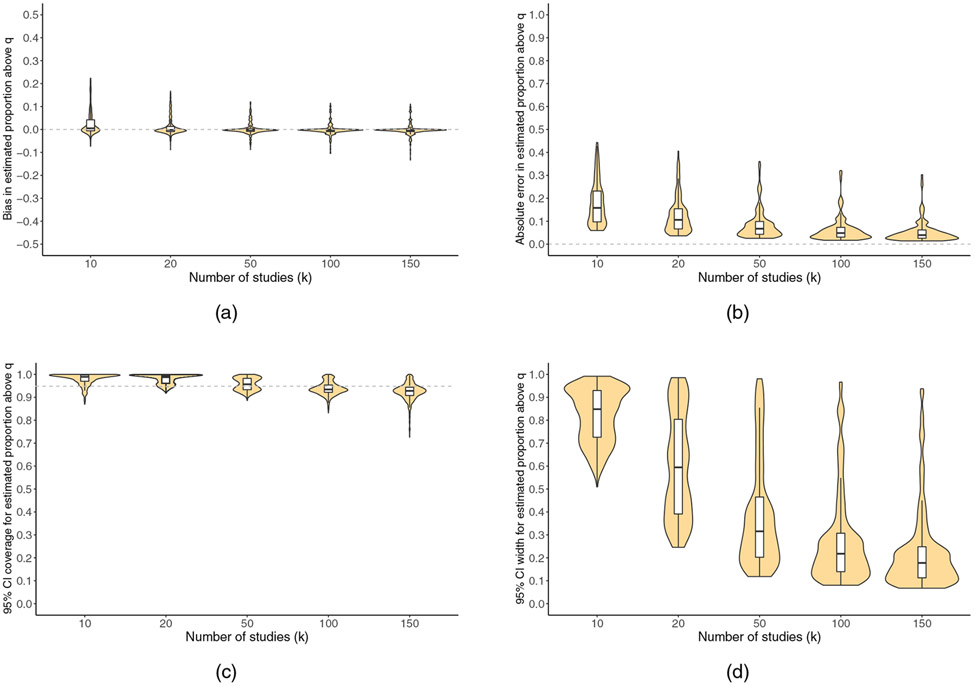
FIGURE 4.
For , violin plots showing the number of meta-analyzed studies (k) versus (a) bias, (b) absolute error, (c) 95% confidence interval coverage, and (d) 95% confidence interval width. White boxplots display the median, 25th percentile, and 75th percentile. Horizontal dashed reference lines represent perfect performance

