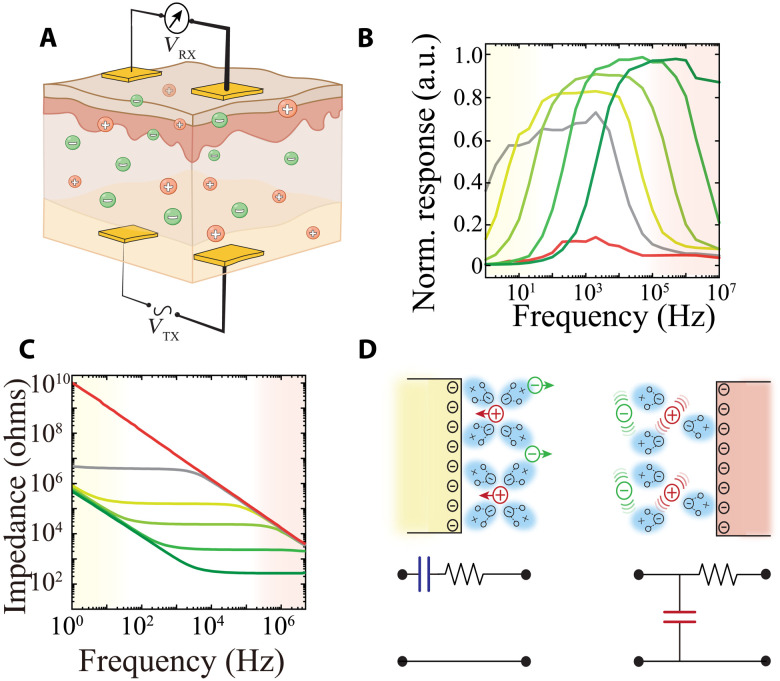
Fig. 1. Configuration and characterization of IC.
(A) Cross-sectional schematic illustration of an IC device consisting of an implanted transmitter (TX) electrode pair inside a biological tissue with ionic charge carriers [anions (green) and cations (red)], and a receiver electrode pair (RX) on the surface of the tissue. VTX denotes the transmitter signal, while VRX represents the measured voltage from the RX outside of tissue. (B) Frequency responses of IC acquired in 10−3, 10−2, 10−1, and 1× PBS (darker shades represent higher concentrations), deionized water (DI; gray), and isopropyl alcohol (IPA; red) with a 1-Hz to 10-MHz VTX sweep signal. Interelectrode spacing and distance between TX and RX arrays were fixed at 25 mm. a.u., arbitrary units. (C) Electrochemical impedance of an IC electrode as a working electrode in the same media as (B); color scheme as per (B). Ag/AgCl electrodes were used as counter and reference electrodes. (D) Schematic of EDL capacitance (yellow, top left) at electrode/electrolyte interface and its corresponding simplified series RC model (bottom left). Schematic of capacitance resulting from media polarizability (red, top right) and its parallel RC model (bottom right).

