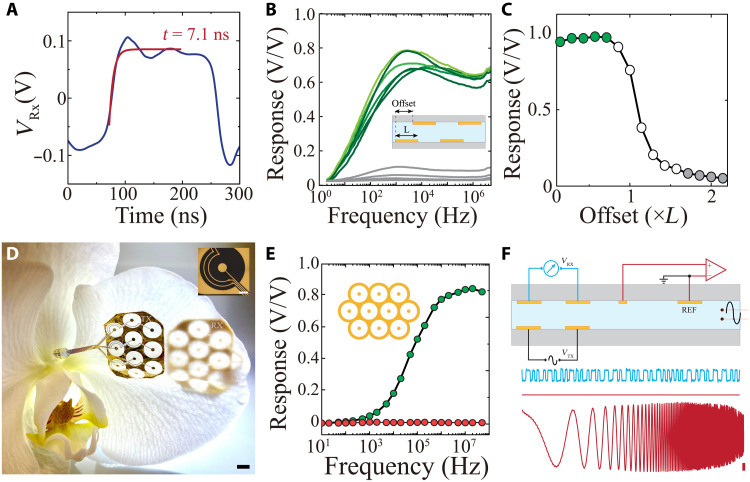
Fig. 5. IC establishes high-bandwidth, digital, parallel data communication using conformable electronic substrates.
(A) Received square pulse at the RX before slicing and digitization. The red trace is the exponential fit of the IC RX voltage before digitization, resulting in a time constant of 7.1 ns (W, L, D = 5 mm). (B) Comparison of frequency responses acquired when RX and TX arrays were positioned inside (green) and outside (gray) line of sight. Inset: Cross-sectional schematic illustrating the experimental setup for measuring IC response at various offsets between TX and RX pairs. (C) The response of IC as a function of RX and TX positional offset. Green markers show IC response for positions where the RX is within TX’s line of sight, whereas unfilled and gray markers indicate partial alignment or full misalignments of TX and RX, respectively (L = 25 mm). (D) Four-micrometer-thick, parallelized (10 links) IC TX and RX arrays conforming to the surface of an orchid petal; scale bar, 5 mm. Optical micrograph of one of the coaxial-shaped IC links; scale bar, 500 μm. (E) Frequency response of 10-link IC-based communication resulting in stable high response at ~60 MHz bandwidth (black). The red trace shows the absence of cross-talk between two nearby RX and TX pairs. (F) Cross-sectional schematic of simultaneous electrophysiological recording and digital IC signal transmission (with 2-MHz, 50-mV amplitude VTX). Lower blue traces show the extracted digital at RX before digitization, and the two red traces are concurrent electrophysiological measurements of ground (top) or a sweep signal (bottom; 1 to 10 KHz; scale bar, 1 mV amplitude). The RMS noise of electrophysiologic (0.1 to 7500 Hz) recordings during operation of IC was 2.7 μVrms compared to 2.4 μVrms without IC operation.

