Fig 1.
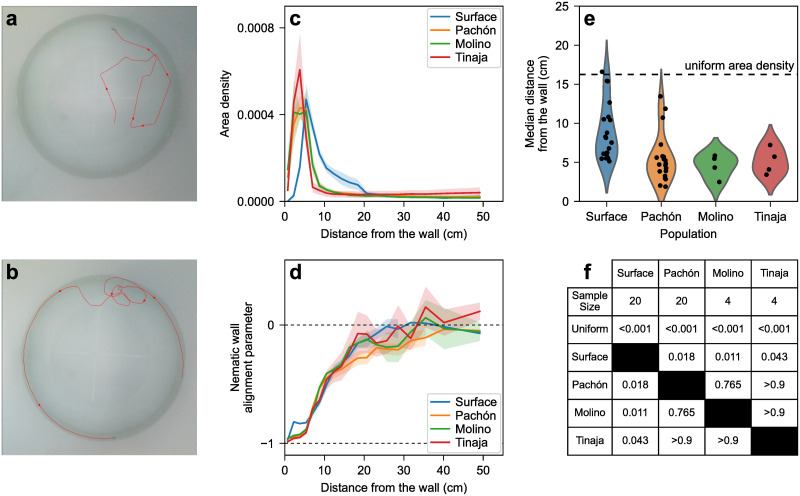
(a) Snapshot from a video of a single surface fish. The red line is the trajectory over the 25 seconds leading to the snapshot. (b) Similar snapshot and 25 s-trajectory from a video of a single Pachón cavefish. (c) Fish density probability per unit area as a function of the distance from the wall for single fish trials for each population. The distance varies between 0 cm (right against the wall) and 55.5 cm (center of the tank). The halo around each curve corresponds to one standard error on either side of the mean. (d) Average nematic alignment parameter relative to the wall (cos(2θ) where θ is the angle between the fish’s heading and the closest wall’s normal vector) as a function of the distance to the wall. Values near -1 indicate strong alignment parallel to the wall. Values near 0 suggest no favored orientation. The halo around each curve corresponds to one standard error on either side of the mean. (e) Median distance from the wall in each trial, by population. The dashed line is the median distance with a uniform area density (tank radius times ; half of the tank’s area is within that distance of the wall). (f) Median distance from the wall statistics. Every population is different from the uniform case (Shapiro test, then T-test if normal or Wilcoxon test if not, NSu = 20, NPa = 20, NMo = 4, NTi = 4, p < 0.001 for every population). Cave populations are different from surface fish, but not from each other (Kruskal-Wallis test, p = 0.0015, then Games-Howell test, pSu−Pa = 0.018, pSu−Mo = 0.011, pSu−Ti = 0.043, pPa−Mo = 0.765, pPa−Ti > 0.9, pMo−Ti > 0.9).

