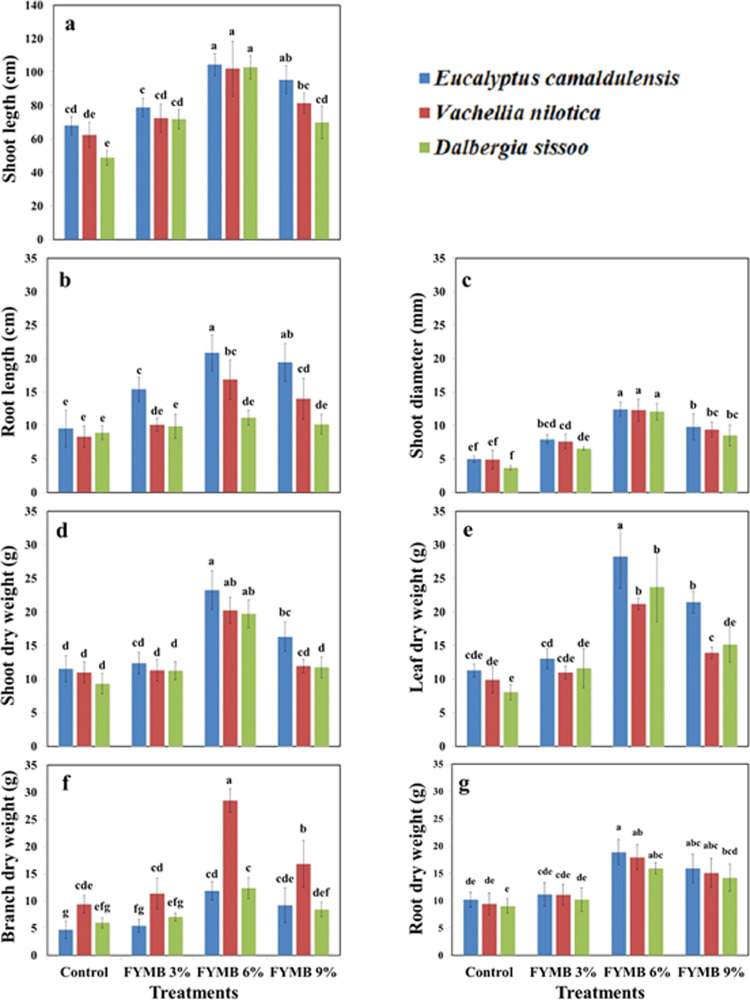
Fig 1. Growth parameters of plants against three different levels of Farmyard Manure Biochar.
These values are three replicates, and for each replication, there were three plants (n = 9). The difference between lower case letters indicates that values are significantly (p < 0.05) different from each other.

