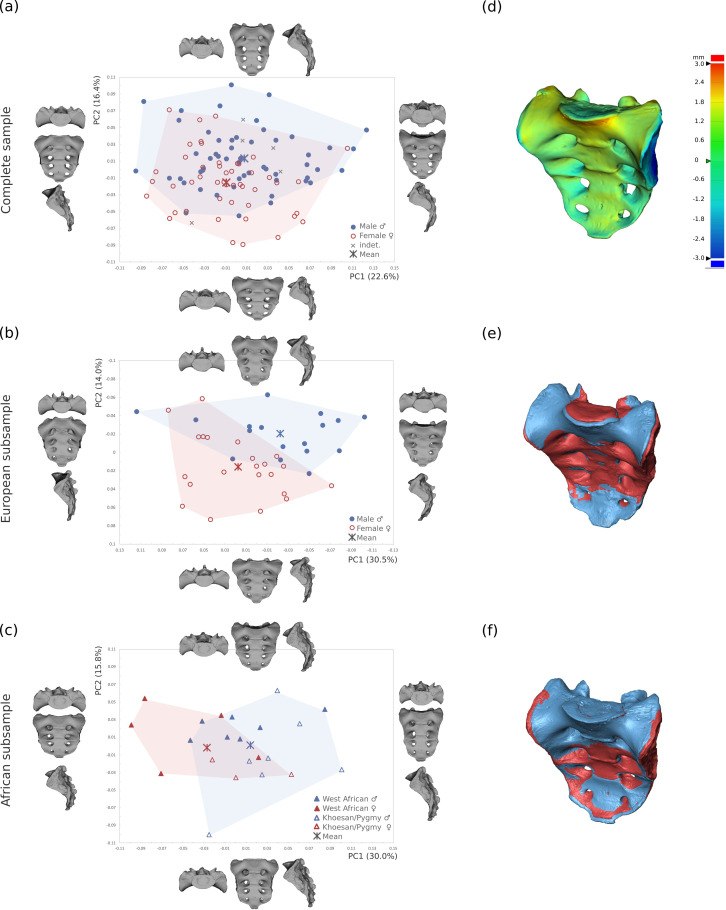
Fig 2. PCA plots of the Procrustes shape coordinates (PC1 vs. PC2).
PCA plot of (a) the complete sample (n = 107), (b) the European subsample (n = 39), and (c) the African subsample (n = 23). The thin-plate-spline warps represent the real shape variation at the extremes of the ranges of variation. (d) Colour-coded representation of the morphology changes from the female into the male mean shape of the entire sample. Warm colours indicate a positive deviation, cold colours denote a negative deviation. Superimposed male (blue) and female (red) mean shapes in the (e) European and (f) African subsamples.

